erage, taller today than they were 200 years ago. Today, the mean height of

Algebra & Trigonometry with Analytic Geometry
13th Edition
ISBN:9781133382119
Author:Swokowski
Publisher:Swokowski
Chapter9: Systems Of Equations And Inequalities
Section9.3: Systems Of Inequalities
Problem 13E

Related questions
Question
Humans are, on average, taller today than they were 200 years ago. Today, the mean height of
14-year-old boys is about 65 inches. Use the following relative frequency distribution of heights
of a group of 14-year-old boys from the 19th century to answer the following questions.
Transcribed Image Text:b. Find a, the slope of the least-squares line, and b, the y-intercepts of the least-squares line.
DULY
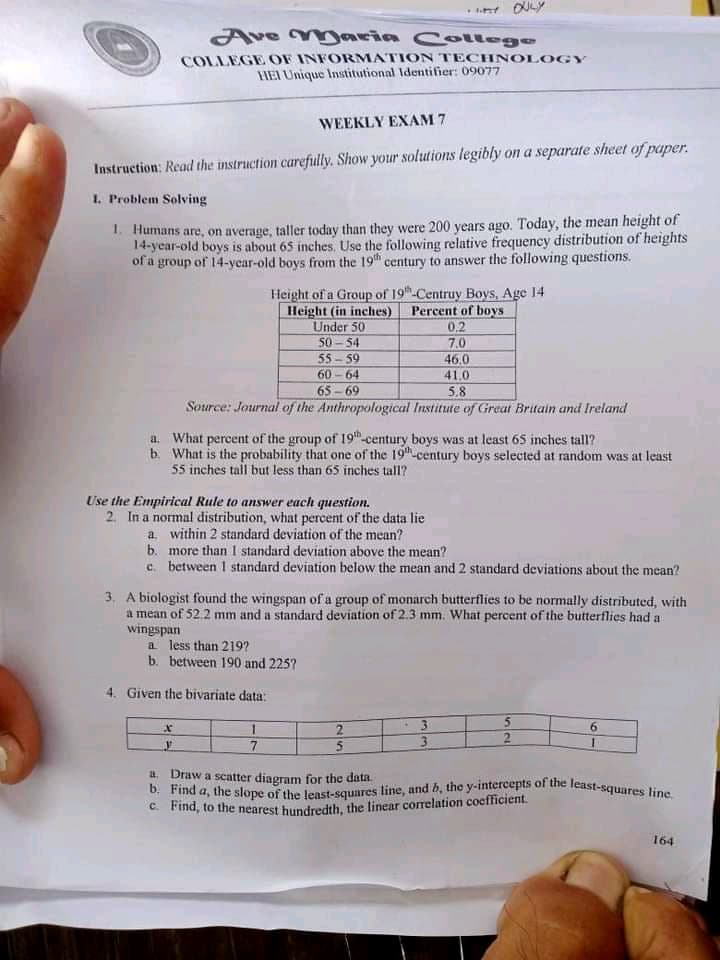
Ave Daria College
COLLEGE OF INFORMATION TECHNOLOGY
HEI Unique Institutional Identifier: 09077
WEEKLY EXAM 7
Instruction: Read the instruction carefully. Show your solutions legibly on a separate sheet of paper.
1. Problem Solving
1. Humans are, on average, taller today than they were 200 years ago. Today, the mean height of
14-year-old boys is about 65 inches. Use the following relative frequency distribution of heights
of a group of 14-ycar-old boys from the 19th century to answer the following questions.
Height of a Group of 19h-Centruy Boys, Age 14
Height (in inches)
Under 50
50-
Percent of boys
0.2
54
7.0
55- 59
46.0
60 - 64
41.0
65 - 69
5,8
Source: Journal of the Anthropological Institute of Great Britain and Ireland
a. What percent of the group of 19"-century boys was at least 65 inches tall?
b. What is the probability that one of the 19h-century boys selected at random was at least
55 inches tall but less than 65 inches tall?
Use the Empirical Rule to answer each question.
2. In a normal distribution, what percent of the data lie
a. within 2 standard deviation of the mean?
b. more than I standard deviation above the mean?
c. between I standard deviation below the mean and 2 standard deviations about the mean?
3. A biologist found the wingspan of a group of monarch butterflies to be normally distributed, with
a mean of 52.2 mm and a standard deviation of 2.3 mm. What percent of the butterflies had a
wingspan
a less than 219?
b. between 190 and 225?
4. Given the bivariate data:
2
3.
3
a. Draw a scatter diagram for the data.
C. Find, to the nearest hundredth, the linear correlation cocfficient.
164
Expert Solution
This question has been solved!
Explore an expertly crafted, step-by-step solution for a thorough understanding of key concepts.

Step by step
Solved in 2 steps with 1 images

Recommended textbooks for you
Algebra & Trigonometry with Analytic Geometry
Algebra
ISBN:
9781133382119
Author:
Swokowski
Publisher:
Cengage
Algebra & Trigonometry with Analytic Geometry
Algebra
ISBN:
9781133382119
Author:
Swokowski
Publisher:
Cengage