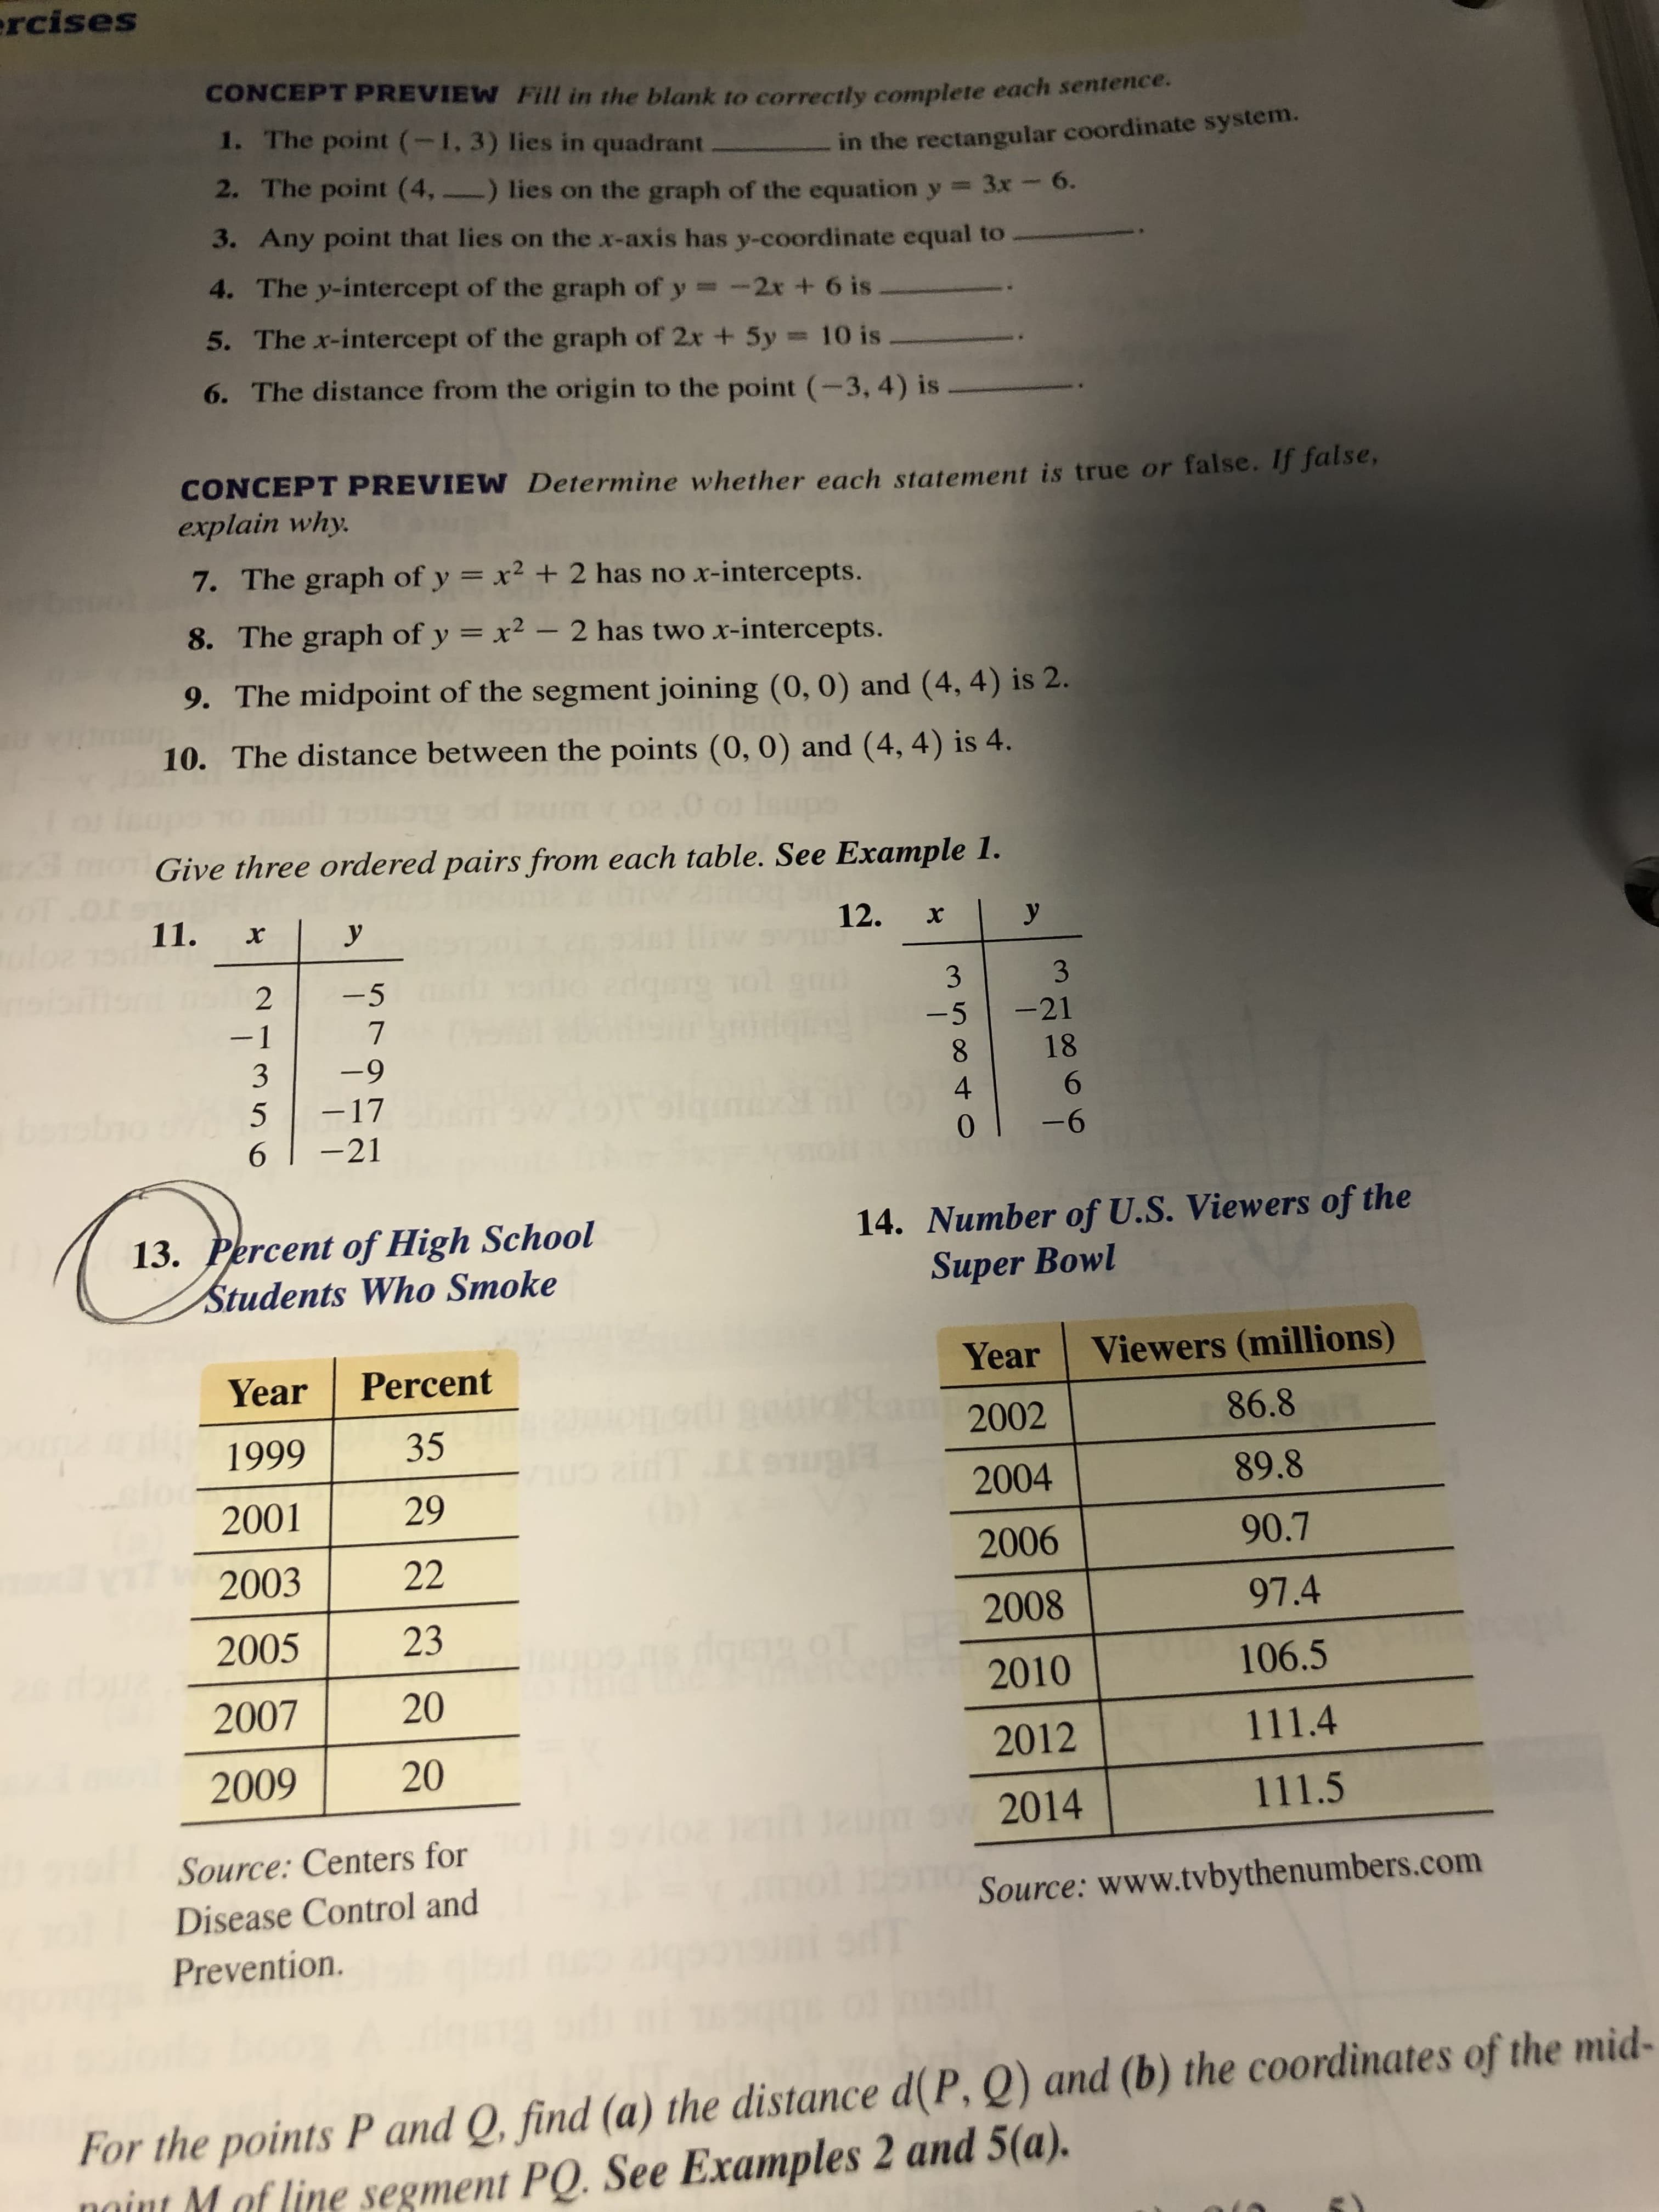
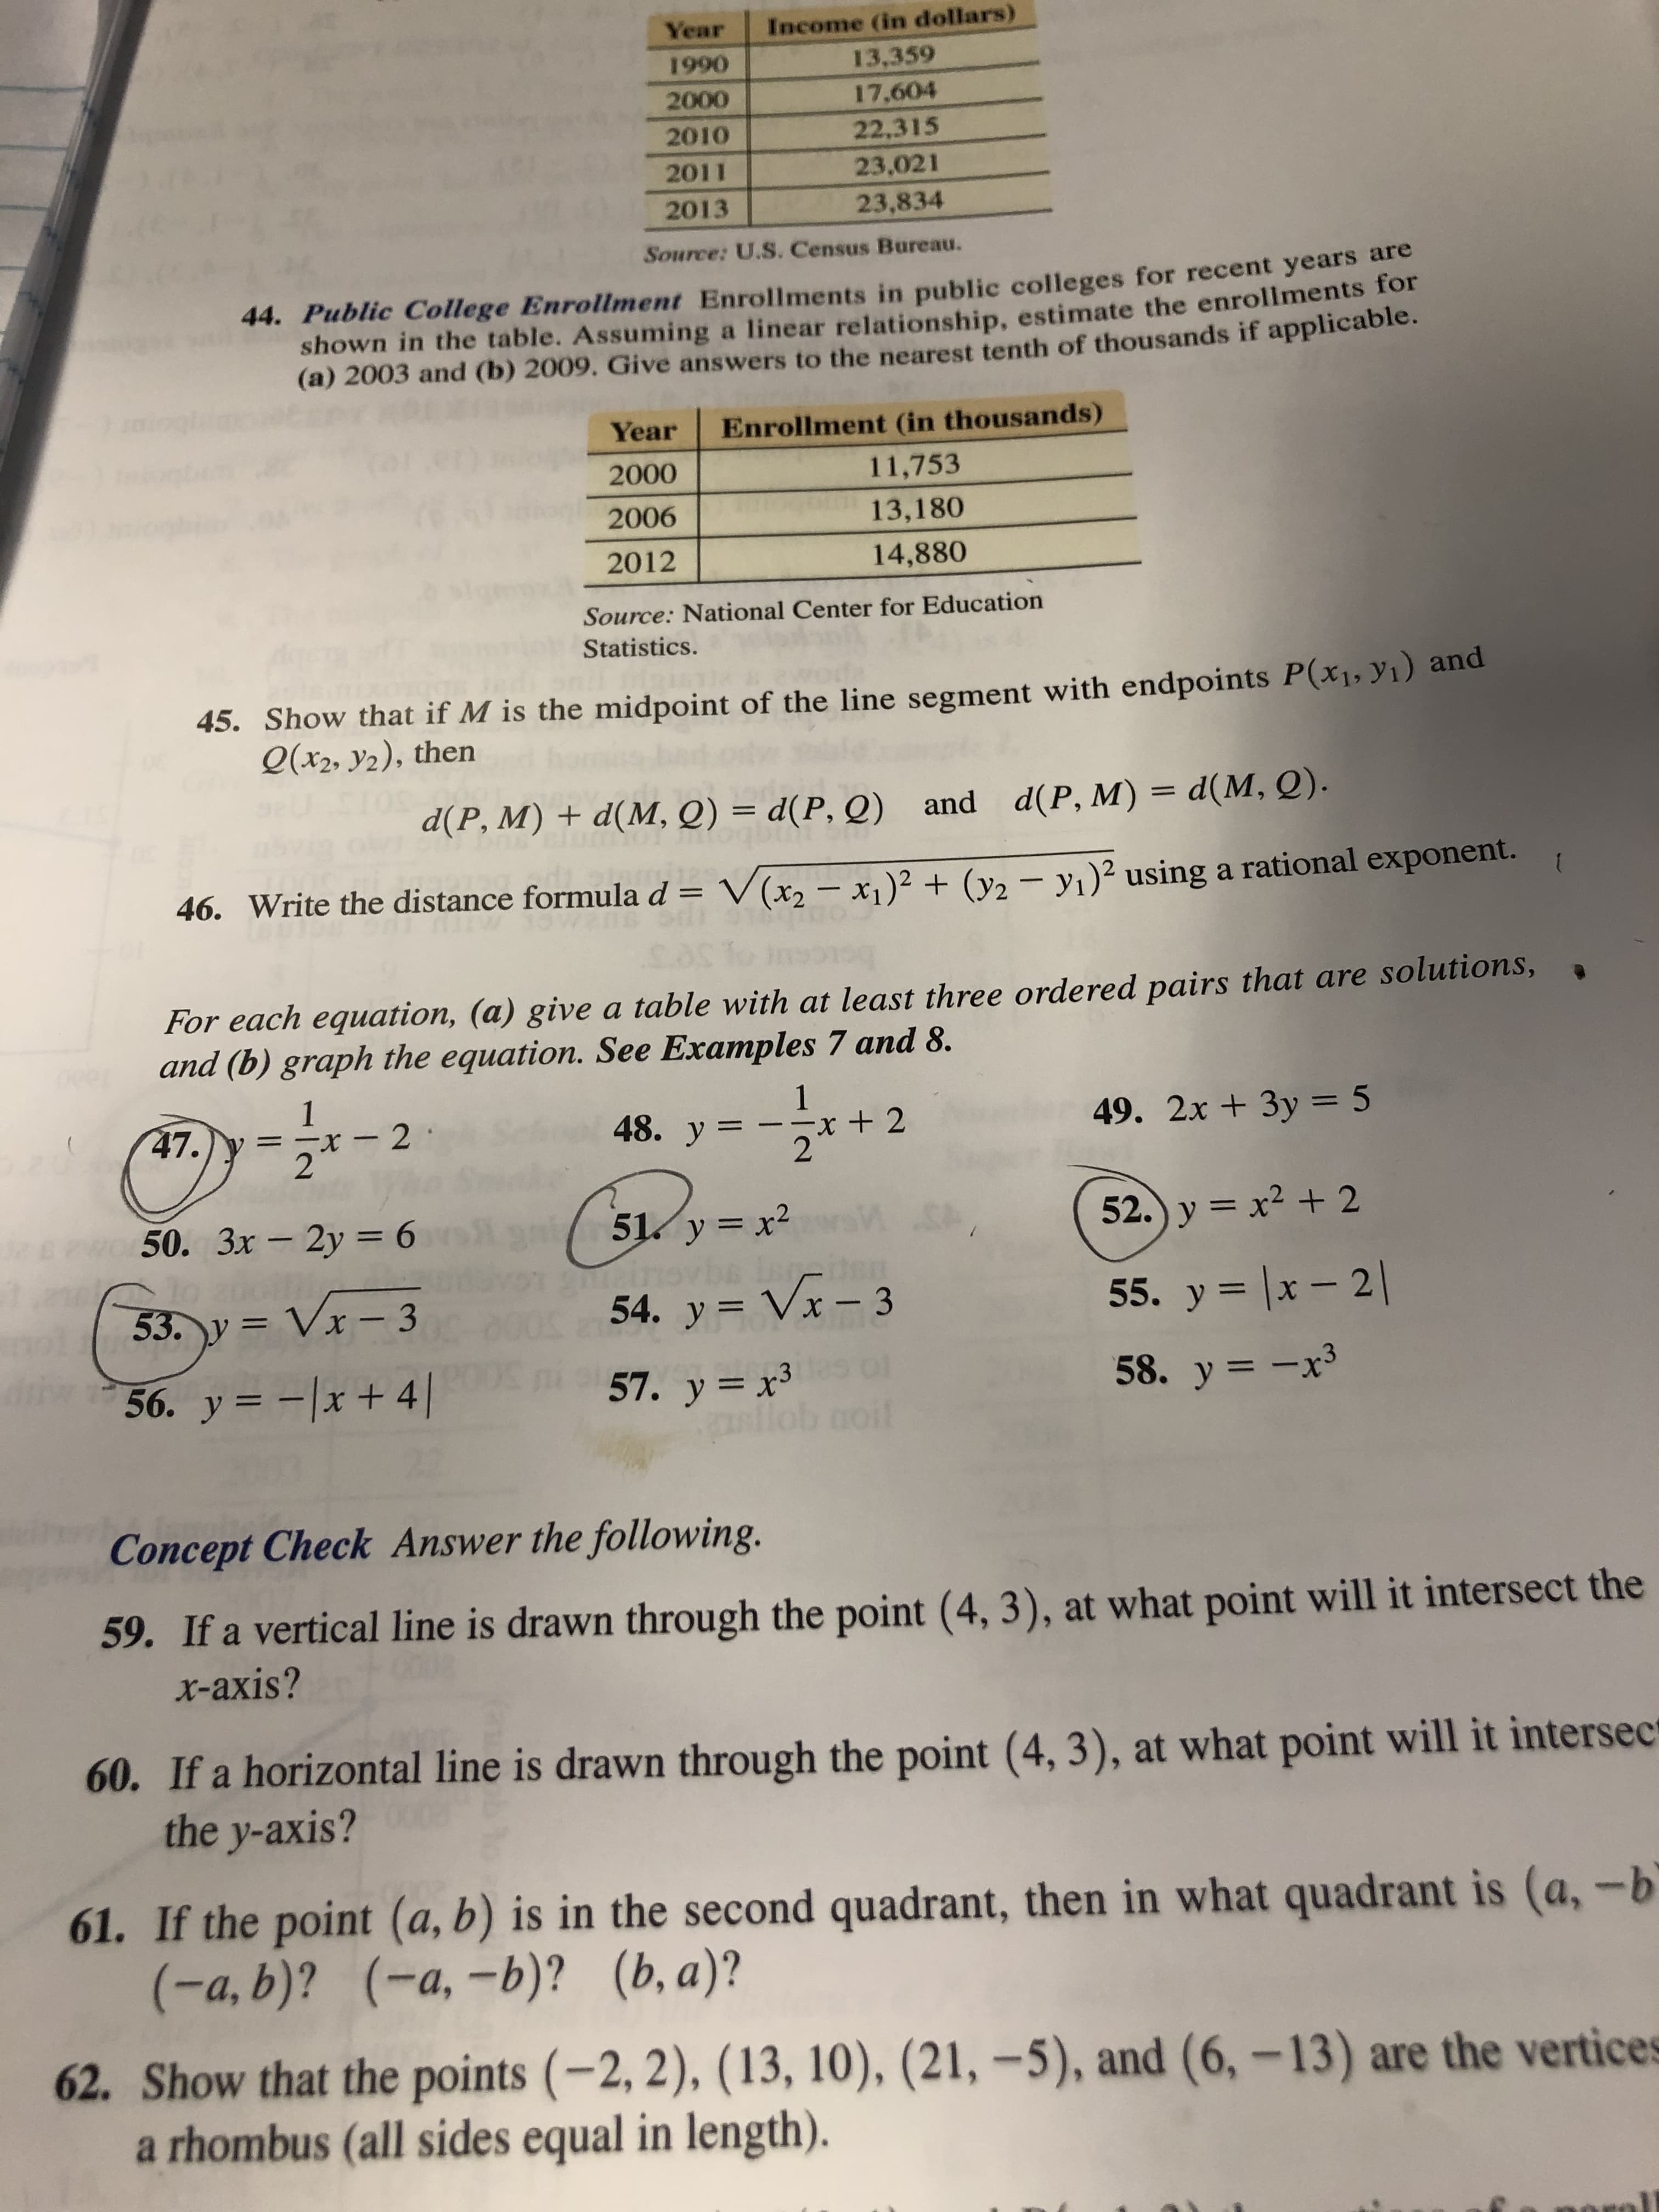
ercises CONCEPT PREVIEW Fill in the blank to correctly complete each sentence. 1. The point (-1, 3) lies in quadrant 2. The point (4, in the rectangular coordinate system. 3x-6. ) lies on the graph of the equation y 3. Any point that lies on the x-axis has y-coordinate equal to 4. The y-intercept of the graph of y -2x + 6 is 5. The x-intercept of the graph of 2x + 5y 10 is 6. The distance from the origin to the point (-3, 4) is CONCEPT PREVIEW Determine whether each statement is true or false. If false, explain why. 7. The graph of y = x² + 2 has no x-intercepts. 8. The graph of y = x² – 2 has two x-intercepts. 9. The midpoint of the segment joining (0, 0) and (4, 4) is 2. 10. The distance between the points (0, 0) and (4, 4) is 4. Give three ordered pairs from each table. See Example 1. 11. x 12. У У х dgeng -5 3 -1 -21 8. 18 -9 borobno 5 6. 6. -17 9- -21 14. Number of U.S. Viewers of the Super Bowl 13. Percent of High School Students Who Smoke Viewers (millions) Year Percent Year 86.8 2002 35 1999 89.8 2004 29 (b) 2001 90.7 2006 22 2003 97.4 2008 23 2005 106.5 2010 20 2007 111.4 2012 20 2009 111.5 m ow 2014 isvlo Source: Centers for Source: www.tvbythenumbers.com Disease Control and Prevention. For the points P and Q, find (a) the distance d(P, Q) and (b) the coordinates of the mid- naint Maf line segment PQ. See Examples 2 and 5(a). 3584t 3. Year Income (in dollars) 13,359 1990 17,604 2000 22,315 2010 23,021 2011 2013 23,834 Source: U.S. Census Bureau. 44. Public College Enrollment Enrollments in public colleges for recent years are shown in the table. Assuming a linear relationship, estimate the enrollments for (a) 2003 and (b) 2009. Give answers to the nearest tenth of thousands if applicable. Enrollment (in thousands) Year 2000 11,753 2006 13,180 2012 14,880 Source: National Center for Education Statistics. 45. Show that if M is the midpoint of the line segment with endpoints P(x1, y1) and Q(x2, y2), then d(P, M) = d(M, Q). d(P, M) + d(M, Q) = d(P, Q) and %3D 46. Write the distance formula d = V(x2 – x )² + (y2 – yı)² using a rational exponent. %3D For each equation, (a) give a table with at least three ordered pairs that are solutions, and (b) graph the equation. See Examples 7 and 8. 1 = --x + 2 2 47. 48. y 49. 2x + 3y = 5 r-2· 50. 3x - 2y = 6 52.) y = x² + 2 51. y = x2 54. y = Vx – 3 55. y= |x – 2| 53. y = Vx – 3 dw5 of 57. y= x³ aoil 56. y = -|x+ 4|| 58. y= -x³ Concept Check Answer the following. 59. If a vertical line is drawn through the point (4, 3), at what point will it intersect the x-axis? 60. If a horizontal line is drawn through the point (4, 3), at what point will it intersec the y-axis? 61. If the point (a, b) is in the second quadrant, then in what quadrant is (a, -b (-a,b)? (-a, -b)? (b, a)? 62. Show that the points (-2, 2), (13, 10), (21, –5), and (6, –13) are the vertices a rhombus (all sides equal in length).


Addition Rule of Probability
It simply refers to the likelihood of an event taking place whenever the occurrence of an event is uncertain. The probability of a single event can be calculated by dividing the number of successful trials of that event by the total number of trials.
Expected Value
When a large number of trials are performed for any random variable ‘X’, the predicted result is most likely the mean of all the outcomes for the random variable and it is known as expected value also known as expectation. The expected value, also known as the expectation, is denoted by: E(X).
Probability Distributions
Understanding probability is necessary to know the probability distributions. In statistics, probability is how the uncertainty of an event is measured. This event can be anything. The most common examples include tossing a coin, rolling a die, or choosing a card. Each of these events has multiple possibilities. Every such possibility is measured with the help of probability. To be more precise, the probability is used for calculating the occurrence of events that may or may not happen. Probability does not give sure results. Unless the probability of any event is 1, the different outcomes may or may not happen in real life, regardless of how less or how more their probability is.
Basic Probability
The simple definition of probability it is a chance of the occurrence of an event. It is defined in numerical form and the probability value is between 0 to 1. The probability value 0 indicates that there is no chance of that event occurring and the probability value 1 indicates that the event will occur. Sum of the probability value must be 1. The probability value is never a negative number. If it happens, then recheck the calculation.
Answer the


Trending now
This is a popular solution!

Step by step
Solved in 4 steps with 4 images


