Errors in medical prescriptions occur relatively frequently. In a study, two groups of doctors had similar er rates and one group switched to e-prescriptions while the other continued with hand-written prescriptions. year later, the number of errors was measured. The results are given in the two-way table. Error No Error Electronic 254 3594 Written 1478 2370 a). Fill in the row and column totals. b). What proportion of all the prescriptions had errors in them? c). What proportion of electronic prescriptions had errors in them?
Errors in medical prescriptions occur relatively frequently. In a study, two groups of doctors had similar er rates and one group switched to e-prescriptions while the other continued with hand-written prescriptions. year later, the number of errors was measured. The results are given in the two-way table. Error No Error Electronic 254 3594 Written 1478 2370 a). Fill in the row and column totals. b). What proportion of all the prescriptions had errors in them? c). What proportion of electronic prescriptions had errors in them?

Glencoe Algebra 1, Student Edition, 9780079039897, 0079039898, 2018
18th Edition
ISBN:9780079039897
Author:Carter
Publisher:Carter
Chapter10: Statistics
Section10.6: Summarizing Categorical Data
Problem 13CYU

Related questions
Question
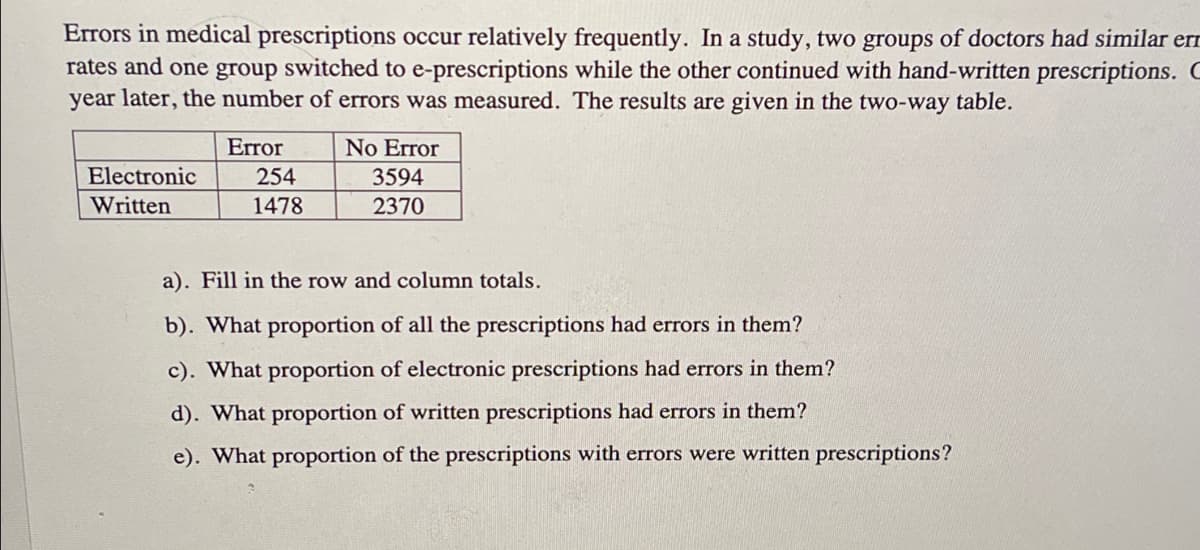
Transcribed Image Text:Errors in medical prescriptions occur relatively frequently. In a study, two groups of doctors had similar err
rates and one group switched to e-prescriptions while the other continued with hand-written prescriptions. C
year later, the number of errors was measured. The results are given in the two-way table.
No Error
Error
254
Electronic
3594
Written
1478
2370
a). Fill in the row and column totals.
b). What proportion of all the prescriptions had errors in them?
c). What proportion of electronic prescriptions had errors in them?
d). What proportion of written prescriptions had errors in them?
e). What proportion of the prescriptions with errors were written prescriptions?
Expert Solution
This question has been solved!
Explore an expertly crafted, step-by-step solution for a thorough understanding of key concepts.

This is a popular solution!

Trending now
This is a popular solution!

Step by step
Solved in 4 steps with 3 images

Recommended textbooks for you
Glencoe Algebra 1, Student Edition, 9780079039897…
Algebra
ISBN:
9780079039897
Author:
Carter
Publisher:
McGraw Hill

Holt Mcdougal Larson Pre-algebra: Student Edition…
Algebra
ISBN:
9780547587776
Author:
HOLT MCDOUGAL
Publisher:
HOLT MCDOUGAL
Glencoe Algebra 1, Student Edition, 9780079039897…
Algebra
ISBN:
9780079039897
Author:
Carter
Publisher:
McGraw Hill
Holt Mcdougal Larson Pre-algebra: Student Edition…
Algebra
ISBN:
9780547587776
Author:
HOLT MCDOUGAL
Publisher:
HOLT MCDOUGAL