etch the graph that shows Z0.42 and then determine Zo.42- ick here to view page 1 of the normal distribution table. ick here to view page 2 of the normal distribution table. Choose the correct graph below. OA. OB. 0.42 G -20.42 0 20.42 Now determine Z0.42- Z0.42 = 0.42 (Round to two decimal places as needed.) 20.4
etch the graph that shows Z0.42 and then determine Zo.42- ick here to view page 1 of the normal distribution table. ick here to view page 2 of the normal distribution table. Choose the correct graph below. OA. OB. 0.42 G -20.42 0 20.42 Now determine Z0.42- Z0.42 = 0.42 (Round to two decimal places as needed.) 20.4

Glencoe Algebra 1, Student Edition, 9780079039897, 0079039898, 2018
18th Edition
ISBN:9780079039897
Author:Carter
Publisher:Carter
Chapter10: Statistics
Section10.4: Distributions Of Data
Problem 19PFA

Related questions
Question
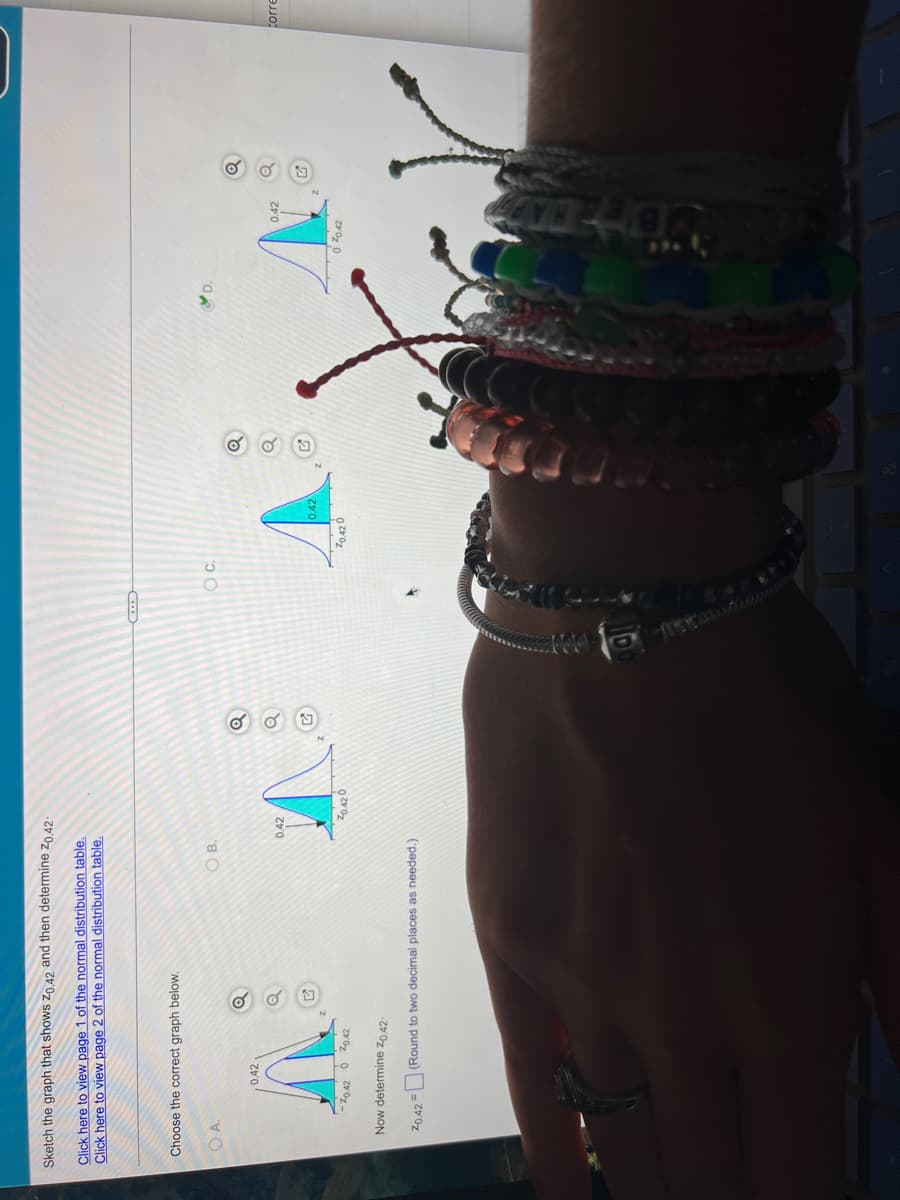
Transcribed Image Text:Sketch the graph that shows Z0.42 and then determine Z0.42-
Click here to view page 1 of the normal distribution table.
Click here to view page 2 of the normal distribution table.
Choose the correct graph below.
OA.
OB.
0.42
2
-20.42 00.42
Now determine Zo.42-
Z0.42 (Round to two decimal places as needed.)
0.42
70.42 0
G
・・・
O C.
0.42
20.420
Q
0.42
0 20.42
2
corre
Expert Solution
This question has been solved!
Explore an expertly crafted, step-by-step solution for a thorough understanding of key concepts.

This is a popular solution!

Trending now
This is a popular solution!

Step by step
Solved in 2 steps

Recommended textbooks for you
Glencoe Algebra 1, Student Edition, 9780079039897…
Algebra
ISBN:
9780079039897
Author:
Carter
Publisher:
McGraw Hill
Glencoe Algebra 1, Student Edition, 9780079039897…
Algebra
ISBN:
9780079039897
Author:
Carter
Publisher:
McGraw Hill