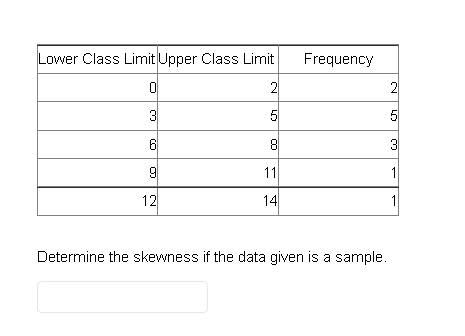
etermine the skewness if the data given is a sample.


Q: Please help with d, e, & f. The world's smallest mammal is the Kitti's hog-nosed bat, with a mean…
A: given dataμ=1.5σ=0.25normal distribution
Q: (A) The population [N] and the sample [n] are similar in that they should be comprised of people…
A: A population is a set of all items or individuals of interest. It contains all members of a specific…
Q: Class Problem Estimate the coefficients for the model y₁ = bo + b₁x₁ + εi. x² 1 9 25 b₁ x иышн 1 3 5…
A:
Q: Read and Understand Annabeth wants to find out the severity of ADHD symptoms of her fellow teenagers…
A: The mean and standard deviation (SD) of the experimental group is observed as 4.4 and 0.3,…
Q: The following linear hypothesis can be tested using the F-test with the exception of: a. b. C. d.…
A: Given that a) H0:b1b2=1 and b3b4=0 b) H0:b1+b2=1 and b2=1b4 which can be written as…
Q: e graph of the accumulated class data. What is the average mass of the pennies in g? How does it…
A: Year Year of Pennies no of pennies weighed Total mass Average Mass 2000 2000 50 122.5982 2.451964…
Q: Suppose I roll a fair dice, with outcomes 1, 2, 3, 4, 5, 6. Consider the following events: E = {2,…
A: Introduction: It is required to choose the correct option.
Q: A sample of n = 5 scores has Σ X = 20 and Σ X2 = 180. For this sample, what is the value of the…
A: The sample size is, n = 5 scores.
Q: Two different people, acting independently, had to pick a number between 1 and 11, inclusive. What…
A: given data 2 persons acting independently, pick a number between 1 and 11 inclusive p(they had…
Q: Let XN(3, 4) and let Y~ N(2, 3). Define S = X + 3Y, where 'X and Ya atistically independent RVs.…
A: Given that: X~N3,4Y~N2,3S=X+3Y, X and Y are…
Q: 1. Suppose that 40% of the incoming calls involve fax messages, and consider a sample of 25 A…
A: Givenp=0.40sample size(n)=25Let "x" be no.of calls involve fax messageP(X=x)=(nx)×px×(1-p)n-x ;…
Q: 1. (Use Lynch's Formula) How many sample units must be obtained from 6,500 CSTCians if a 5% margin…
A: Given: Population size is 6500 Margin of error is 5% i.e., 0.05 Required: To find the number sample…
Q: Consider the bar graph, which shows the numbers and percentages of bachelor's degrees in engineering…
A: The objective is to determine the ratio of the number of men to the number of women earning…
Q: Use your graphing utility’s linear regression option to obtain a model of the form y = ax + b that…
A: Given data:
Q: In a 2019 survey of 533 high school students nationwide, 49% of respondents said they were…
A: Research is the study used to understand the population. Research based on several methods, they are…
Q: b) 400 labourers were selected at random from a certain district. Their mean income was 160.5 rupees…
A: Given that: Sample size, n=400 Sample mean, x¯=160.5 The confidence level is 95%. Sample standard…
Q: If a variable has a distribution that is bell-shaped with mean 16 and standard deviation 7 then…
A: given data normal distribution μ = 16σ = 7 according to the Empirical Rule,68.0% of the data will…
Q: You do not need to label the axes for a histogram, but you do need The bar graph shows categorical…
A: The statements about two graphs are given. i) Bar graph ii) Histogram Bar graph and histogram both…
Q: I have a bag containing 40 blue marbles and 60 red marbles. I choose 4 marbles (without replacement)…
A:
Q: Time left 0:24:11 The item refers to the Table below which shows the scores obtained by ten students…
A:
Q: Brand & Model Overall Score Samsung Ultrabook NP900X3C-ADIUS Apple MacBook Air MCLL/A Apple MacBook…
A: Given data: Price($) Overall Score 1250 83 1300 83 1200 82 950 79 800 77 1200 74…
Q: Fill out the table below: C 0 1 2 P(x) 0.59 0.6 0.62 xP(x) x² P(x)
A: Given: X P(X) 0 0.59 1 0.6 2 0.62
Q: . The mean salary in a certain plant was $1500, and the standard devi- ation was $400. A year later…
A: Concept: Standard deviation is unaffected when you add or subtract a number but it changes when you…
Q: When using 1-Var Stats on a scientific or graphing calculator, the resulting statistical output…
A: Introduction: It is required to discuss about the difference between the two different types of…
Q: Construct a confidence interval for P₁ P2 at the given level of confidence. x₁ =397, n₁ = 523, Xx2 =…
A: It is given that, For the first sample: x1 (no. of sample elements with some defined…
Q: please explain how to use the standard deviation from the 1-Var Stats statistical output to obtain…
A: Hint: Standard devation =Variance
Q: (a) Given that four airlines provide service between Chicago and California In how many distinct…
A:
Q: Describe multiple regression?
A: Regression analysis enables the inference or prediction of a variable from one or more other…
Q: Exposure to microbial products, especially endotoxin, may have an impact on vulnerability to…
A: Data is given for Urban homes and Farm homes We have to calculate mean and median for both. We have…
Q: Let X and Y be independent exponentially distributed RVs with parameters A and respectively. Use the…
A: Solution is given below
Q: Create the graphical summary. Write a sentence that describes the data.
A: Given: The data is given as 19 86 27 42 11 12 13 5 27 20 83 4 69 10…
Q: Let Y₁, Y2,..., Yn be a random sample from the inverse Gaussian distribution with probability…
A: Given density function, fy,μ,λ=λ2πy312e-λ2yμ-1y2 if y>0 a) Likelihood function: L=∏i=1nfy…
Q: Consider the following ordered data. 6 9 9 10 11 11 12 13 14 Find the low, Q1,…
A: From the provided information, The number of observations (n) = 9
Q: 5. The Silverthorn Athletic Center wants to know if customers are satisfied with its facilities. It…
A: Self selection bias occurs when individuals select themselves for the survey. Non response bias…
Q: Second answer of C is not the correct answer
A: Given data values 323 326 331 339 350 353 356 359 360 364…
Q: following two-way table. Female Male Total 10 42 7 19 45 108 In a relationship 32 It's complicated…
A: female male total in relationship 32 10 42 its complicated 12 7 19 single 63 45 108…
Q: In constructing a frequency distribution for population, the number of classes depends on OA. None…
A: Formula Used: Number of classes = 1 + 1.33Log(N) Where N is population size.
Q: Determine the conclusion to the hypothesis test with a test statistic of 1.78 for two samples with…
A: Given Information: The test statistic is 1.78 Null Hypothesis H0:μA-μB=0 Alternative Hypothesis…
Q: Q2: Complete the following sentences with the appropriate statistical procedure a) When the mean is…
A: Q2) A) In a normal distribution (symmetric distribution), the mean, median and mode are all equal.…
Q: Identify the kind of sample that is described. A salary committee for a Midwestern college sends an…
A:
Q: Most Americans throw away 1365 pounds of trash each year. Is it reasonable to estimate that…
A: It is given that, most of the Americans throw away 1365 pounds of trash each year.
Q: The president uses technology to produce the following random numbers. 50 61 79 49 54 61…
A: Given: The president uses technology to produce the following random numbers. 50 61 79 49…
Q: Susan has just completed her second semester in college. She earned a grade of A in her 2-hour…
A:
Q: c) When the median is closer to the third quartile, the distribution is skewed to----- a ma ma ma ma…
A: Q2 C) In a symmetric distribution, the mean, median, and mode are all equal. Skewed distributions…
Q: Without calculations, which of the following sets of numbers would have a larger variance?
A: Variance is a measure of dispersion. In other words, how much dispersed the data set is.
Q: OB. O C. Fre Frequency Frequency 56 6.1 6.2 6.3 Weight (grams) 6.2 6.3 6.4 Weight (grams) 6.1 6.1…
A:
Q: Assume this code is six digits long. What is the likelihood that this code will consist of at least…
A: we have 10 digits i.e 0,1,2,3,4,5,6,7,8,9,
Q: In what year will the estimated revenue of Amazon be 1,241 billion US dollars? Note: I am asking…
A: Yearly data is given for Amazon annual revenue. We have to calculate regression equation first Than…
Q: 2. The subjects of your study are the education students in public universities that offers Free…
A: Random Sampling : sample taken randomly from population. Systematic sampling : sample chosen from…
Q: 2. The following is a distribution for the number of workers in 40 companies belonging to a certain…
A: The formula for pth-quantile is as follows: zp=l+np-cff×c where l=lower boundary of class interval…
Determine the skewness if the data given is a sample.

Step by step
Solved in 2 steps

