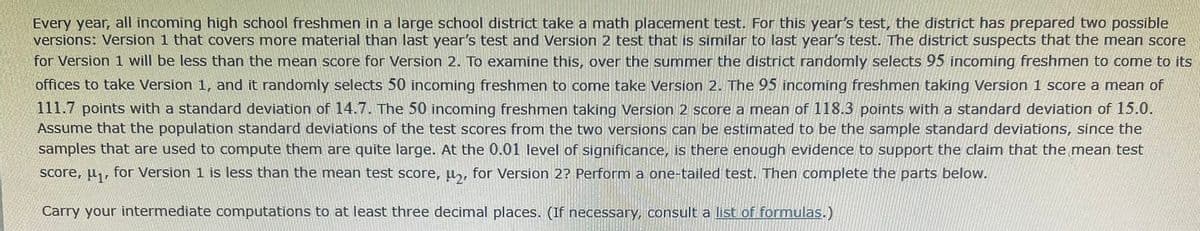
Every year, all incoming high school freshmen in a large school district take a math placement test. For this year's test, the district has prepared two possible versions: Version 1 that covers more material than last year's test and Version 2 test that is similar to last year's test. The district suspects that the mean score for Version 1 will be less than the mean score for Version 2. To examine this, over the summer the district randomly selects 95 incoming freshmen to come to its offices to take Version 1, and it randomly selects 50 incoming freshmen to come take Version 2. The 95 incoming freshmen taking Version 1 score a mean of 111.7 points with a standard deviation of 14.7. The 50 incoming freshmen taking Version 2 score a mean of 118.3 points with a standard deviation of 15.0. Assume that the population standard deviations of the test scores from the two versions can be estimated to be the sample standard deviations, since the samples that are used to compute them are quite large. At the 0.01 level of significance, is there enough evidence to support the claim that the mean test score, , for Version 1 is less than the mean test score, µ,, for Version 2? Perform a one-tailed test. Then complete the parts below. Carry your intermediate computations to at least three decimal places. (If necessary, consult a list of formulas.)
Every year, all incoming high school freshmen in a large school district take a math placement test. For this year's test, the district has prepared two possible versions: Version 1 that covers more material than last year's test and Version 2 test that is similar to last year's test. The district suspects that the mean score for Version 1 will be less than the mean score for Version 2. To examine this, over the summer the district randomly selects 95 incoming freshmen to come to its offices to take Version 1, and it randomly selects 50 incoming freshmen to come take Version 2. The 95 incoming freshmen taking Version 1 score a mean of 111.7 points with a standard deviation of 14.7. The 50 incoming freshmen taking Version 2 score a mean of 118.3 points with a standard deviation of 15.0. Assume that the population standard deviations of the test scores from the two versions can be estimated to be the sample standard deviations, since the samples that are used to compute them are quite large. At the 0.01 level of significance, is there enough evidence to support the claim that the mean test score, , for Version 1 is less than the mean test score, µ,, for Version 2? Perform a one-tailed test. Then complete the parts below. Carry your intermediate computations to at least three decimal places. (If necessary, consult a list of formulas.)

Glencoe Algebra 1, Student Edition, 9780079039897, 0079039898, 2018
18th Edition
ISBN:9780079039897
Author:Carter
Publisher:Carter
Chapter10: Statistics
Section10.3: Measures Of Spread
Problem 1GP

Related questions
Question
Transcribed Image Text:Every year, all incoming high school freshmen in a large school district take a math placement test. For this year's test, the district has prepared two possible
versions: Version 1 that covers more material than last year's test and Version 2 test that is similar to last year's test. The district suspects that the mean score
for Version 1 will be less than the mean score for Version 2. To examine this, over the summer the district randomly selects 95 incoming freshmen to come to its
offices to take Version 1, and it randomly selects 50 incoming freshmen to come take Version 2. The 95 incoming freshmen taking Version 1 score a mean of
111.7 points with a standard deviation of 14.7. The 50 incoming freshmen taking Version 2 score a mean of 118.3 points with a standard deviation of 15.0.
Assume that the population standard deviations of the test scores from the two versions can be estimated to be the sample standard deviations, since the
samples that are used to compute them are quite large. At the 0.01 level of significance, is there enough evidence to support the claim that the mean test
score, u,, for Version 1 is less than the mean test score, u,, for Version 2? Perform a one-tailed test. Then complete the parts below.
Carry your intermediate computations to at least three decimal places. (If necessary, consult a list of formulas.)
Transcribed Image Text:Carry your intermediate computations to at least three decimal places. (If necessary, consult a list of formulas.)
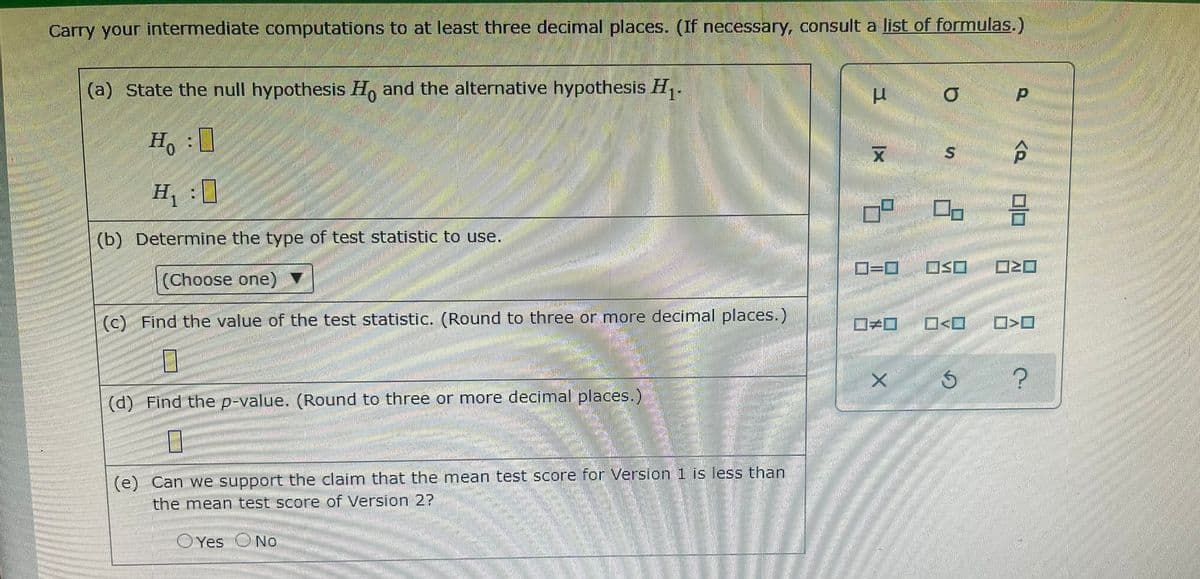
(a) State the null hypothesis H, and the alternative hypothesis H1.
Ho 0
H, :0
(b) Determine the type of test statistic to use.
O=0
OSO
(Choose one)
(c) Find the value of the test statistic. (Round to three or more decimal places.)
ロ=ロ
O<O
(d) Find the p-value. (Round to three or more decimal places.)
(e) Can we support the claim that the mean test score for Version 1 is less than
the mean test score of Version 2?
OYes
No
Expert Solution
This question has been solved!
Explore an expertly crafted, step-by-step solution for a thorough understanding of key concepts.

This is a popular solution!

Trending now
This is a popular solution!

Step by step
Solved in 5 steps with 3 images

Recommended textbooks for you
Glencoe Algebra 1, Student Edition, 9780079039897…
Algebra
ISBN:
9780079039897
Author:
Carter
Publisher:
McGraw Hill
Glencoe Algebra 1, Student Edition, 9780079039897…
Algebra
ISBN:
9780079039897
Author:
Carter
Publisher:
McGraw Hill