Examine the frequency distribution table and bar graph found below for how often people (specifically boys and girls) were seriously injured from fights in the past 12 months. Use the table and graph to answer the following question. Based on the bar graph, which of the following variables would most appropriately be considered the dependent variable? Valid 0 1 2 3 $31013 FREQ-SERIOUS INJURY FROM FIGHT-WI Valid Frequency Percent Percent Total Mean $31013 FREQ-SERIOUS INJURY FROM FIGHT-W1 4 5 6 8 9 11 12 14 364 365 Total Missing Refused Legitimate skip Don't know System Total 19 21 23 50 122 321 2354 294 64 27 10 11 4 1 1 3 7 1 1 1 1 1 1 1 1 1 2785 10 2020 17 2 1.11 48.7 6.1 1.3 6 2 2 Male 1 0 .0 1 1 0 0 0 0 0 0 0 .0 0 57.6 2 41.8 4 2049 42.4 4834 100.0 0 84.5 10.6 2.3 1.0 4 4 1 .0 0 1 3 0 0 .0 0 0 0 0 0 0 100.0 Cumulative Percent BIOLOGICAL SEX-W1 84.5 95.1 97.4 98.3 98.7 99.1 99.2 99.3 99.3 99.4 99.7 99.7 99.7 99.8 99.8 99.9 99.9 99.9 100.0 100.0 回 Female
Examine the frequency distribution table and bar graph found below for how often people (specifically boys and girls) were seriously injured from fights in the past 12 months. Use the table and graph to answer the following question. Based on the bar graph, which of the following variables would most appropriately be considered the dependent variable? Valid 0 1 2 3 $31013 FREQ-SERIOUS INJURY FROM FIGHT-WI Valid Frequency Percent Percent Total Mean $31013 FREQ-SERIOUS INJURY FROM FIGHT-W1 4 5 6 8 9 11 12 14 364 365 Total Missing Refused Legitimate skip Don't know System Total 19 21 23 50 122 321 2354 294 64 27 10 11 4 1 1 3 7 1 1 1 1 1 1 1 1 1 2785 10 2020 17 2 1.11 48.7 6.1 1.3 6 2 2 Male 1 0 .0 1 1 0 0 0 0 0 0 0 .0 0 57.6 2 41.8 4 2049 42.4 4834 100.0 0 84.5 10.6 2.3 1.0 4 4 1 .0 0 1 3 0 0 .0 0 0 0 0 0 0 100.0 Cumulative Percent BIOLOGICAL SEX-W1 84.5 95.1 97.4 98.3 98.7 99.1 99.2 99.3 99.3 99.4 99.7 99.7 99.7 99.8 99.8 99.9 99.9 99.9 100.0 100.0 回 Female

Glencoe Algebra 1, Student Edition, 9780079039897, 0079039898, 2018
18th Edition
ISBN:9780079039897
Author:Carter
Publisher:Carter
Chapter10: Statistics
Section10.6: Summarizing Categorical Data
Problem 4DGP

Related questions
Question
please don't provide hand writtin solution...
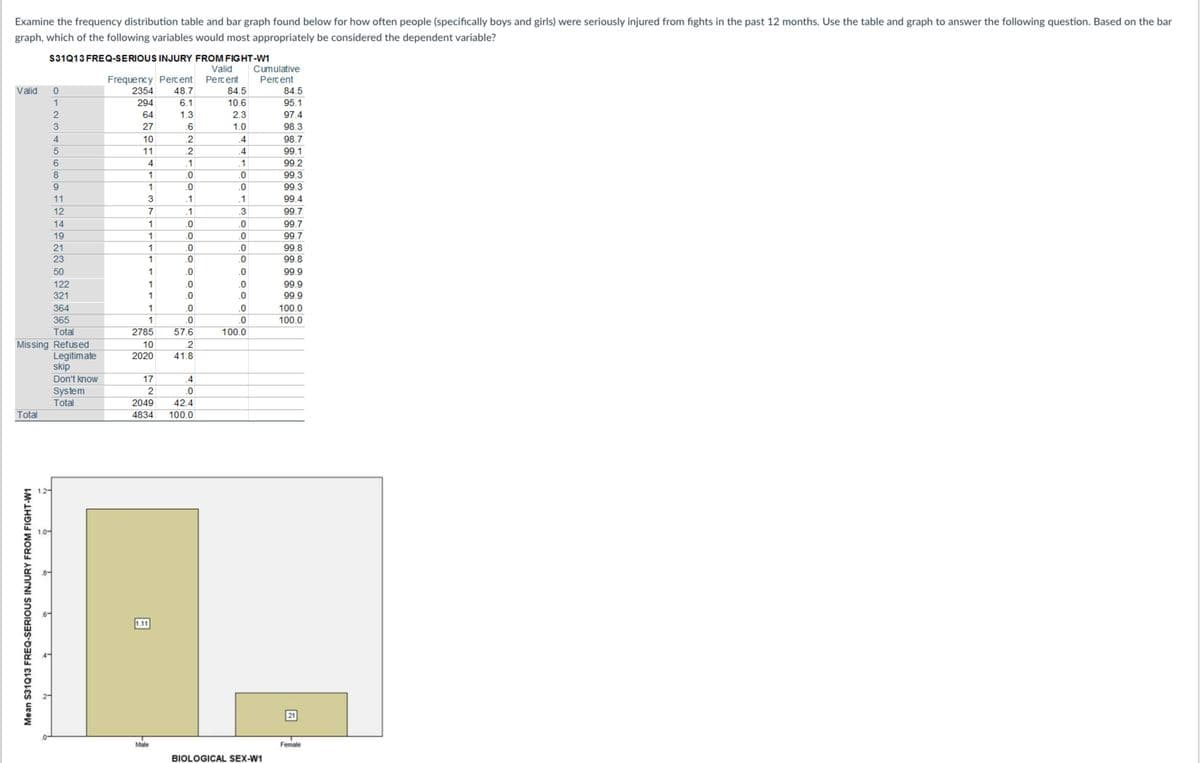
Transcribed Image Text:Examine the frequency distribution table and bar graph found below for how often people (specifically boys and girls) were seriously injured from fights in the past 12 months. Use the table and graph to answer the following question. Based on the bar
graph, which of the following variables would most appropriately be considered the dependent variable?
Valid 0
1
$31Q13 FREQ-SERIOUS INJURY FROM FIGHT-W1
Valid
Frequency Percent Percent
2354 48.7
294
6.1
64
1.3
27
.6
Total
Mean S31Q13 FREQ-SERIOUS INJURY FROM FIGHT-W1
2
3
Missing Refused
2
4
5
6
8
9
11
12
14
19
21
23
50
122
321
364
365
Total
Legitimate
skip
Don't know
System
Total
10
11
4
1
1
3
7
1
1
1
1
1
1
1
1
1
2785
10
2020
17
2
2049
4834
1.11
Male
.2
.2
.1
.0
.0
.1
.1
.0
.0
.0
.0
.0
.0
.0
.0
.0
57.6
2
41.8
.4
.0
42.4
100.0
84.5
10.6
2.3
1.0
4
4
.1
.0
.0
.1
.3
.0
.0
.0
.0
.0
.0
.0
.0
.0
100.0
Cumulative
Percent
BIOLOGICAL SEX-W1
84.5
95.1
97.4
98.3
98.7
99.1
99.2
99.3
99.3
99.4
99.7
99.7
99.7
99.8
99.8
99.9
99.9
99.9
100.0
100.0
21
Female
Expert Solution
This question has been solved!
Explore an expertly crafted, step-by-step solution for a thorough understanding of key concepts.

This is a popular solution!

Trending now
This is a popular solution!

Step by step
Solved in 3 steps with 3 images

Recommended textbooks for you
Glencoe Algebra 1, Student Edition, 9780079039897…
Algebra
ISBN:
9780079039897
Author:
Carter
Publisher:
McGraw Hill

Holt Mcdougal Larson Pre-algebra: Student Edition…
Algebra
ISBN:
9780547587776
Author:
HOLT MCDOUGAL
Publisher:
HOLT MCDOUGAL
Glencoe Algebra 1, Student Edition, 9780079039897…
Algebra
ISBN:
9780079039897
Author:
Carter
Publisher:
McGraw Hill
Holt Mcdougal Larson Pre-algebra: Student Edition…
Algebra
ISBN:
9780547587776
Author:
HOLT MCDOUGAL
Publisher:
HOLT MCDOUGAL