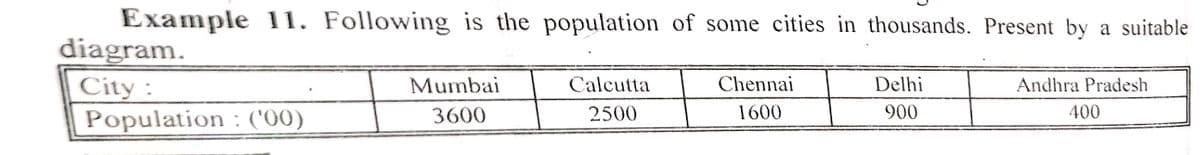
Example 11. Following is the population of some cities in thousands. Present by a suitable Calcutta 2500 diagram. City: Population : ('00) Mumbai 3600 Chennai 1600 Delhi 900 Andhra Pradesh 400


Q: 27. Based on this scenario, determine whether you would use a z-statistic, t- statistic, neither, or…
A: given data we have to find we use z test or t test from 95% CI for μ sample size, n = 23…
Q: (A) Some form of evidence for normality should be provided before doing statistical analyses. (B)…
A: To determine if the underlying data is normal, statisticians use the concept of normality. The…
Q: Q4: The probability mass function of a discrete random variable X is given by the following table: X…
A: Given: The probability mass function of a discrete random variable X is: X P(X) 1 136 2 336…
Q: A problem in statistics is given to three students A,B,C . Whose chances of solving it are…
A:
Q: The following table summarizes the percent of U.S. who have diabetes and the accuracy of the current…
A:
Q: The scores below are the number of caffeinated beverages (coffee, tea, most carbonated soft drinks)…
A: Hint: The formula for calculating population variance is; σ2=1n∑ixi-μ2= 1n∑xi2-μ2 Where μ is the…
Q: What type of scale is used when describing the sex of the runners in a marathon? Select one: a.…
A: Nominal data: Nominal data measure qualitative data and it is the name of variable. example: Smoking…
Q: Find the given sample space and use it to answer the questions below. (Write events in increasing…
A: As per our guidelines we are supposed to answer only 3 sub-parts of any questions so i am solving…
Q: If the probability that a randomly chosen college student is up to date on vaccines is 0.42, then…
A: The question is about probability Given : Prob. of a randomly chosen college stud. is up to date on…
Q: A random sample of 10 subjects have weights with a standard deviation of 11.5602 kg. What is the…
A: Here, in this question, given that a random sample of 10 subjects have weights with standard…
Q: Example 3. Calculate Range and Coefficient of Range for following data. 20-30 30-40 40-50 4 9 16 X:…
A:
Q: Listed below are prices in dollars for one night at different hotels in a certain region. Find the…
A: The prices of for one night at different hotels in a certain region are given.
Q: A Shapiro-Wilk 0.05. Which of the following is best? statements O O result had a p-value of O There…
A: Shapiro-Wilk test is used to test the normality of sample. The null hypothesis in this test is that…
Q: The economy will either be in a state of prosperity or recession and the probability of either is…
A: For the given data At what probability would you be indifferent between venture A&B
Q: An airliner carries 400 passengers and has doors with a height of 76 in. Heights of men are normally…
A: From the provided information, Mean (µ) = 69.0 in. Standard deviation (σ) = 2.8 in. X~N (69.0, 2.8)…
Q: ons with a z-score between Z₁ = 0.53 and 22 = 2.26. Give your answer to four decimal p ns with a…
A: (a) The objective is to find the proportions with a z-score between z1=0.53 and z2=2.26
Q: Your employer wants to compare the performance of two shops owned by your company: Shop A and Shop…
A: Given the amount of sales (in 1,000 Euros) on 7 days randomly selected in the last three months as…
Q: Use the empirical rule to solve the problem (also known as the 68%-95% -99.7% Rule). At one college,…
A:
Q: 2.36 (EX) Does breast-feeding weaken bones? 2/2: Fill in the blanks. DO NOT include the percent sign…
A: We can solve the above question by using EXCEL: step1:Go to Data Analysis step2:Select the…
Q: trated. When the value is above 2500, the market is extremely concentrated. Here, for all the 3…
A: year Bank Loan Advance weight weighted square 2018 STANBIC 2584735 0.446445 0.199313 BARCLAYS…
Q: Assume that we have 13 cards to be taken randomly and without replacement in a standard deck of…
A: Given: 13 cards to be taken from 52 card without replacement out of 13 cards we need to find the…
Q: 5) The average number of telephone calls in a hospital emergency room between 10-11 p.m. is 3. a)…
A:
Q: Let A and B have the joint probability density function f (a,b) = 6(1-a - b) for a+b 0, b>0 and it…
A:
Q: If a sample contains 50 data values then the most convenient number of class intervals (rounded off…
A: Since we know that Class interval In a frequency distribution is defined as Class interval: A class…
Q: In a survey, people were asked how many times per year they had their car in the shop for repairs.…
A: From the provided information, Shop Frequency 0 84 1 83 2 35 3 53
Q: Listed below are prices in dollars for one night at different hotels in a certain region. Find the…
A: From the provided information, The data values are as follow: 240, 82, 93, 259, 88, 192, 86, 264…
Q: As of January 3, 2019, the US House of Representatives had the following demographics: U.S. House of…
A: The given data table is:
Q: a. Mean b. Range c. Standard Deviation
A: Since you have posted a question with multiple sub-parts, we will solve first three subparts for…
Q: Determine the probability density function for the following cumulative distribution function. F(x)…
A: Introduction: It is required to obtain the probability density function, fx for the given cumulative…
Q: During the 2004 senatorial campaign in a large southwestern state, illegal immigration was a major…
A: Hi, since you have posted a question with multiple sub-parts, we will solve first three sub-parts…
Q: Assume that a sample is used to test a normal population mean u. A sample is of size 32 with a mean…
A:
Q: Compute for the following problems stated below. Upload your computation for each problem. Express…
A: The values obtained in the analysis of sodium hydroxide are as follows : 99.5% 99.9% 99.7% 96.9% So…
Q: [C(2x+y), 0≤x≤2, 0≤ y ≤3 0, otherwise b) Iffy (x, y) = i) find the value of C and ii) find P[X2 1,…
A: Powered by Tiny
Q: In Example 6.14, Y₁ and Y₂ were independent exponentially distributed random variables, both with…
A:
Q: large metropolitan area, the past records revealed that 30% of all high school graduates go to…
A: Given that n = 10 , p = 30% = 0.30 , q = 1 - p = 1 - 0.30 = 0.70 X ~ Binomial ( n = 10 , p = 0.30)…
Q: How do I explain if the mean and median are different, comparing the tibia length before and after…
A: Mean is the average of all the data set and it is the measure of central tendency. It is calculated…
Q: Assume a population of 42, 49, 52, and 58. Assume that samples of size n=2 are randomly selected…
A:
Q: Suppose that the waiting times for patients at a local hospital are normally distributed with known…
A: The waiting times for patients at a local hospital are normally distributed with known population…
Q: A professor in a university is trying to conduct a research study. His study is trying to determine…
A: Introduction: It is required to identify the confounding variable, and suggest a solution to fix it.
Q: The relative frequency of motorcyclist's aged between 20 and 50 who were fatally injured in traffic…
A:
Q: The probability distribution of a discrete random variable X is given in Table Q3. Table Q3 1 x 2…
A:
Q: (A) Null hypotheses cannot be made with non-normal data. (B) Alternative hypotheses cannot be made…
A: In stating the null and alternative hypotheses, the data does not have to be normal data. Hypotheses…
Q: An article in Urban Ecosystems, "Urbanization and Warming of Phoenix (Arizona, USA): Impacts,…
A: Data given 23.3,21.7,21.6,21.7,21.3,20.7,20.9,20.1
Q: 1) The height distribution of a (somewhat bizarre) population can be written as f(h) = a(h-ho) over…
A: Given the height distribution of a population as fh=ah-h0 , h0≤h≤h10 , h0>h>h1…
Q: s weathering time (months) categorical or quantitative variable
A: Given that Weathering time ( months )
Q: Emilio, the owner of Pepe Delgados, is interested in taking a more statistical approach to…
A: Since you have posted a question with multiple sub parts, according to our guidelines we can solve…
Q: 8. If you know that ΣX² = 114, EX = 20, n = 4, the sample standard deviation will be C) 5.7 A) 4.66…
A:
Q: Consider the endothermic reactions given below. Let A denote the event that a reaction's final…
A: Given: A is the event that a reaction's final temperature is 271K or less. B is the event that the…
Q: Let X1, X2, X3, and X4 be a random sample of observations from a population with mean μ and…
A: The given estimator of μ is θ^=0.15X1+0.35X2+0.20X3+0.30X4. Also given that X1, X2, X3, and X4 be a…
Q: Given the data below are the number of students in each age group. Number of students 2 4 Ages 15-18…
A: Given data:

Step by step
Solved in 3 steps with 3 images

- 1. Suppose that, in Example 2.27, 400 units of food A, 600 units of B, and 600 units of C are placed in the test tube each day and the data on daily food consumption by the bacteria (in units per day) are as shown in Table 2.6. How many bacteria of each strain can coexist in the test tube and consume all of the food? Table 2.6 Bacteria Strain I Bacteria Strain II Bacteria Strain III Food A 1 2 0 Food B 2 1 1 Food C 1 1 2Consider the following data set for an office structure built by Anderson Construction Co. The completed building is nine stories. However, construction was interrupted by a fire after 5.3357 floors were completed. At the time of the fire, Anderson had used 54,067 hours of labor to construct the first 5.3357 stories of the building. It then took Anderson an additional 40,750 labor hours to complete this nine-story building. In this problem, FLRCOM is the number of floors completed, and HOURS is cumulative labor hours to complete the number of floors given by FLRCOM. Enter the data for FLRCOM and HOURS in Minitab and use one command to create a variable which is the square of FLRCOM. Call this new variable FLRCOMSQ. Estimate the function: HOURS = a + b(FLRCOM) + c(FLRCOMSQ). Graph this equation. Assume that the fire caused construction to slow down and caused a reduction in efficiency in completing the building. Estimate the number of labor hours needed to complete the building if…Question 1“PhysicalFun” is a physical center which opens 24 hours per day. Each member of “PhysicalFun” has an access card. Members would be charged in a weekly basic (Sunday 12:00a.m. to Saturday 11: 59 p.m.) according to the accumulated number of hours of facilities used within a week. The weekly basic charge is $150 with an additional charge of $30 per hour. According to the company record, the number of hours a member spends in “PhysicalFun” in a week is normally distributed with mean 15 hours and standard deviation 2.8 hours.(a) What are the average and standard deviation of weekly charge of a member?(b) Suppose the middle 85% of weekly charge of a member is denoted by $(L1, L2). Find the values of L1 and L2.(c) The senior management suggests fixing the weekly charge per member at $700. Assume the number of hours a member spends in “PhysicalFun” would not be changed due to the change of the weekly charge calculation method. What proportion of members would pay more money than the…
- The following data were collected in the study described in Problem 1 relating hypertensive status measured at baseline to incident stroke over 5 years. Free of Stroke at 5 Years Stroke Baseline: Not Hypertensive 932 58 Baseline: Hypertensive 254 106 Compute the incidence of stroke in this study, overall. 0.294 0.121 0.059 0.879The problem is on the first image attached, and the second image is the data to go with it.A covariance of 0.01 between data set A and data set B indicates: A strong tendency for B to increase when A increases A weak relationship between A and B A strong tendency for B to decrease when A increases Not enough information to say
- A Hospital allocates much of the budget in preparation for the top two seasonal diseases in the locality. Based on their records the frequencies of seasonal disease occurring in the locality are given in the following table: DISEASE A. 25% DISEASE B. 50% OTHERS. 25% Of 100 current patients in the hospital, 36 suffered with the disease A, 47 suffer with Disease B, and 17 suffer with other seasonal diseases. The hospital wants to know if their budget is sufficient by checking whether the above frequencies fit the data from their records. Analyze the problem using chi-square test at 0.05 significance level.Question 4a. A large accountancy firm finds that over the long run 10% of its statements for clients are in error in some way. A quality assurance officer at the firm investigating the source of the errors takes a sample of 20 statements produced by a single employee and classifies each as being “in error” or “not in error”.i. If the variable X is used to represent the number of statements in the sample that are in error, and assuming the error rate is the firm’s level of 10% then state:• the type of distribution this variable has; and• the parameter/s of this distribution. ii. Determine the probability that 2 or less returns in this sample are in error. The quality assurance officer found that there were 5 statements in the sample that were in error.iii. Determine the probability of finding 5 or more returns in error if indeed the error rate was 10%. iv. Based upon your answer for part iii., what conclusion might the quality assurance office make about this employee in terms of the…Question 12** The following table lists the approximate number of adults (18+) who are obese (BMI ≥ 25) in North America in 2014 by country and gender. Female Obese Male Obese Female Not Obese Male Not Obese Canada 11 M 12 M 7 M 6 M Mexico 40 M 37 M 21 M 22 M U.S.A. 101 M 113 M 61 M 44 M (adapted from http://apps.who.int/gho/data/node.main.A897A?lang=en) Based on this data, what is the probability that a randomly selected male in North America will be obese? Answer in decimal form. Round to 3 decimal places as needed. Your Answer:
- Here is the data and scenario for the above questions: An ornithologist is studying the role of color in flower selection for a particular species of hummingbird. He places 3 lilac bushes with similar size, flower yield, and scent profile near a known hummingbird habitat--one with white flowers, one with pink flowers, and one with purple flowers. He then uses surveillance cameras to count hummingbird visits to each of the 3 bushes for 30 days. The daily visit count data for each lilac color bush is summarized below: White Pink Purple Mean: 17.2 17.8 18.5 S.Dev: 1.9 1.4 2.6 (Hint for calculations: What is n here, and why? What are the actual data sets corresponding to each mean?) What does the ornithologist conclude? Do you have a recommendation for further study?Question 4 a The researcher is concerned that older persons may not be knowledgeable of the COFLU-20. Assuch, he is interested in investigating the association between the age of the respondents and theirknowledge level. Table 2 below shows the knowledge level of respondents, by age group.Table 2Age Group Knowledge Level TotalPoor Satisfactory Good18 - 25 33 16 13 6226 - 34 30 18 12 6035 - 44 29 14 12 5545 - 54 36 16 18 7055 - 75 17 14 22 53Total 145 78 77 300 Conduct a test, at the 5% level of significance, to determine whether the data provided sufficientevidence to conclude that an association exists between age group and knowledge level. (i) State the hypotheses to be tested:H0:H1: Calculate:(ii) state the degrees of freedom for this test (iii) the p-value for this test, given that the chi-square test statistic, x2, is 11.029. (iv) state the conclusion for the test. Give reason for your answer.QUESTION 4(a) The researcher is concerned that older persons may not be knowledgeable of the COFLU-20. Assuch, he is interested in investigating the association between the age of the respondents and theirknowledge level. Table 2 below shows the knowledge level of respondents, by age group.Table 2Age Group Knowledge Level TotalPoor Satisfactory Good18 - 25 33 16 13 6226 - 34 30 18 12 6035 - 44 29 14 12 5545 - 54 36 16 18 7055 - 75 17 14 22 53Total 145 78 77 300Conduct a test, at the 5% level of significance, to determine whether the data provided sufficientevidence to conclude that an association exists between age group and knowledge level.(i) State the hypotheses to be tested:H0:H1: Calculate:(ii) state the degrees of freedom for this test (iii) the p-value for this test, given that the chi-square test statistic, 2, is 11.029.(iv) state the conclusion for the test. Give reason for your answer.