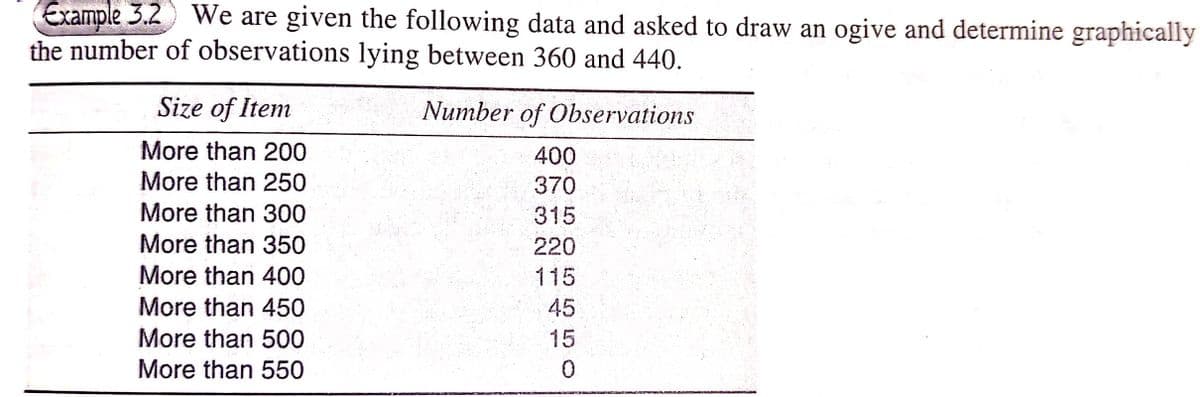
Example 3.2 We are given the following data and asked to draw an ogive and determine graphicall the number of observations lying between 360 and 440. Size of Item Number of Observations More than 200 400 More than 250 370 More than 300 315 More than 350 220 More than 400 115 More than 450 45 More than 500 15 More than 550
Example 3.2 We are given the following data and asked to draw an ogive and determine graphicall the number of observations lying between 360 and 440. Size of Item Number of Observations More than 200 400 More than 250 370 More than 300 315 More than 350 220 More than 400 115 More than 450 45 More than 500 15 More than 550

Glencoe Algebra 1, Student Edition, 9780079039897, 0079039898, 2018
18th Edition
ISBN:9780079039897
Author:Carter
Publisher:Carter
Chapter10: Statistics
Section10.2: Representing Data
Problem 24PFA

Related questions
Question
100%
Transcribed Image Text:Example 3.2 We are given the following data and asked to draw an ogive and determine graphically
the number of observations lying between 360 and 440.
Size of Item
Number of Observations
More than 200
400
More than 250
370
More than 300
315
More than 350
220
More than 400
115
More than 450
45
More than 500
15
More than 550
Expert Solution
This question has been solved!
Explore an expertly crafted, step-by-step solution for a thorough understanding of key concepts.

Step by step
Solved in 2 steps with 2 images

Recommended textbooks for you
Glencoe Algebra 1, Student Edition, 9780079039897…
Algebra
ISBN:
9780079039897
Author:
Carter
Publisher:
McGraw Hill

Functions and Change: A Modeling Approach to Coll…
Algebra
ISBN:
9781337111348
Author:
Bruce Crauder, Benny Evans, Alan Noell
Publisher:
Cengage Learning

Glencoe Algebra 1, Student Edition, 9780079039897…
Algebra
ISBN:
9780079039897
Author:
Carter
Publisher:
McGraw Hill
Functions and Change: A Modeling Approach to Coll…
Algebra
ISBN:
9781337111348
Author:
Bruce Crauder, Benny Evans, Alan Noell
Publisher:
Cengage Learning