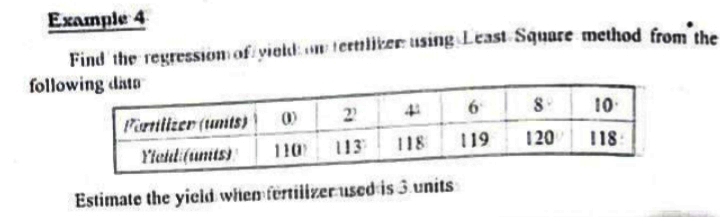
Example 4 Find the regression of yield terttliker using Least Square method fromibe following dato Partilizer (tumts) 10 44 Yleldi(units) 110 113 118 119 120 118 Estimate the yicld wihen fertiiizer used is 3 units


Q: 19. (a) The sum of 50 observation is 500 its sum of squares is 6,000 and median 12. Find the coeffic...
A: Solution-: (a) We have, N=50,∑X=500,∑X2=6000,Median=12 We find, Coefficient of variation (CV) and C...
Q: Assume the random variable Xhas a binomial distribution with the given probability of obtaining a su...
A: Given;X~binomial(n,p)where, number of trials(n)=5and probability of success(p)=0.6find P(X≤1)=?we kn...
Q: A cutting tool wears out with a time to failure that is normally distributed. It is known that about...
A:
Q: Explain what is an outlier and how it may affect the data results of an investigation
A: We have to explain an outlier and write how it may affect the data results of an investigation.
Q: Insurance: An Insurance company sells a l-year term life Insurance policy to an 85-year-old woman. T...
A:
Q: II. _Using the ages of male and female persons below, Pair (No.) Male (M) Age Female (F) Age 1 21 20...
A: The ages of male and female given We have to answer for mentioned questions by summation rule.
Q: Example 5. In the bending of an elastic beam the normal stress y at distance x from the middle secti...
A:
Q: When is the mean a poor description of a frequency distribution? O When the distribution has a small...
A: Mean : A data set's mean is used to summarise it. It's a metric for determining where a data set's c...
Q: Using the TI-84 calculator, find the area under the standard normal curve that lies between the foll...
A: To find the area under the standard normal curve that lies between the following z-values:
Q: Twenty years ago, Juan Medina and Bertha Zenith got married. The Medina-Zenith family's biggest life...
A: Given information: Twenty years ago, Juan Medina and Bertha Zenith got married. The Medina-Zenith fa...
Q: 1. (b) The following table gives the frequency distribution of the sales (in '000 Rs.) of salesperso...
A: We find cumulative frequencies for every class to create cumulative frequency Curve.
Q: From the following data of age of employecs, calculate coefficient Example: of skewness and comment ...
A: Solution is given: Hope the answer is helpful.
Q: For the following data 2 5 10 12 15 14 15 (i) Find line of regression of Y on X (ii) Estimate Y for ...
A:
Q: TRUE / FALSE) If θ^MM is the MM estimator of θ, f(θ^MM ) is the MM estimator of f(θ) where f is a co...
A: Solution
Q: You work for the U.S. Food and Drug Administration. You have gotten word that a drug manufacturing i...
A:
Q: A researcher claims that the amounts of acetaminophen in a certain brand of cold tablets have a mean...
A: Given: n = 29 x¯ = 597.9 s = 3.8 α = 0.01
Q: r 63. The frequency distribution of marks obtained by 60 students of a class in college is given bel...
A:
Q: Example 5.2 Consider the following problem of hypothesis testing based on a sam- ple of size one, i....
A:
Q: Determine the mean of all sample modes. Based on your result, is the sample mode an unbiased estima...
A: Mean of all sample modes, Modes: 0,0,10, 0,0,0,0,10, 10, 10 Mean of modes= (10+10+10+10)/10 = 4
Q: average hours of sleep per night that college students get. 2 %3D Margin of Error: E = We are 98% co...
A:
Q: (a) What is the n? (b) What is the p (use two places after the decimal)? (c) What is the q (use two ...
A: here given, In the Utah study, among participants who reported contact with a family member with kno...
Q: In a large group of young couples, the stan- dard deviation of the husbands' ages is four years, and...
A:
Q: explain this elements of Sampling? 1. Sample is the representative of all the characters of the pop...
A: 1) Sample is the representative of all characters of the population. This means that if we choose sa...
Q: Consider the random variable X that represents the number of people who are hospitalized or died in ...
A:
Q: Compute the standard deviation. Round the answer to three decimal places.
A: Given data is Number of Days Frequency 0 28 1 437 2 263 3 75 4 16 5 11 Total 830 ...
Q: 1 Show that each of the following is a probability mass function *.ifxe (1,2) (0, otherwise. 1. P(X ...
A: Solution
Q: 2. The following data relate to advertising expenditure (in lakh of rupees) and their corresponding ...
A:
Q: A researcher wishes to estimate the mean length of North American adult bullfrogs. To do so, a rando...
A: Solution-: Given: x¯=130.1cm,n=69,σ=24.2,α=0.01 We find, Intermediate values: Z_{tab}=? SE=? Maximum...
Q: A random sample of size 16 was collected which gave the sample mean of 7 and a sample variance of 11...
A:
Q: (a) Compute both P(X < 4) and P(X < 4). P(X < 4) = 0.629 P(X < 4) = 0.433 (b) Compute P(4 < X < 9). ...
A: Note: According to Bartleby expert guidelines, we can answer only first question with their three su...
Q: find the value ofk
A: Here use formula of mean
Q: A not A total В 0.55 not B 0.55 0.34 total 1
A:
Q: How many 3-digit numbers can we make using the digits 2, 3, 4, 5, and 6 without repetitions?
A: here available digit 2,3,4,5 and 6 total 5 digits available
Q: Confidence intervals on the variance is very sensitive on the normality of the data whie the confide...
A: Confidence interval of variance assumes normality of samples, and is very sensitive to the sample di...
Q: 2.4-10. A certain type of mint has a label weight of 20.4 grams. Suppose that the probability is 0.9...
A:
Q: . What does it mean for a sample to be representative? a. The sample is very large. b. The sample ha...
A: Note: if given population mean(μ) and population standard deviation(σ) and sample size (n) then samp...
Q: Pain: A recent survey asked 830 people how many days they would wait to seek medical treatment If th...
A: Given data, P(Person waits more than 3 days)=?
Q: You work for the U.S. Food and Drug Administration. You have gotten word that a drug manufacturing i...
A:
Q: The mean length of steel bolts from a manufacturing process is advertised as 15.1 mm. An inspector b...
A:
Q: Lower limit: Upper limit:
A: here given 15 sample data n=15 df =n-1 =14 t critical for 99% confidence level and df =14 t-critica...
Q: In a batch of 10 students, the marks obtained by them in a test of statistics are as follows. 7, 8, ...
A:
Q: (b) Compute the correlation coefficient between the price of eggs and the price of milk. Round the a...
A: Define the variable dozen eggs as x and the variable gallon of milk as y.
Q: IV. Solve the problem. (don't forget to attached the solution) The Xiaomi brand releases three cellp...
A: Given that, the Xiaomi brand releases three cellphones that are tested at random.
Q: A paper filter manufacturer supplies filters of nominal grammage equal to 455 g/m2. A customer accep...
A:
Q: (Confidence Interval forapredicted value) Given the regression equa- tion: WTI = -2.3% + (0.64)(S&P5...
A:
Q: (d) What is the 75th percentile of the distribution? (Round your answer to four decimal places.) (e)...
A:
Q: (a) Find the probability distribution. The probability distribution is 1600 P (x)
A:
Q: 3. Opportunity Cost Ana and Dina are roommates. They spend most of their time studying (of course), ...
A: below is the answer of the question asked:
Q: Mr. X. wants to determine on the basis of sample study the mean time required to complete a certain ...
A:
Q: 2. Calculate Karl-person's coefficient of skewness for the following data. 25,15,23, 40, 27, 25, 23,...
A: Given: 25 15 23 40 27 25 23 25 20

Step by step
Solved in 3 steps with 3 images

- Researchers are investigating how the amount of monthly rainfall, measured in centimeters (cm), affects the monthly growth, in cm, of a certain plant. From a sample of data, the researchers created a least-squares regression line. Computer output is shown in the following table. Which of the following statements is an interpretation of the value 0.75 shown in the table?In a regression based on 30 annual observations, U.S. farm income was related to four independent variables—grain exports, federal government subsidies, population, and a dummy variable for bad weather years. The model was fitted by least squares, resulting in a Durbin-Watson statistic of 1.29. The regression of e2i on ŷi yielded a coefficient of determination of 0.043.a. Test for heteroscedasticity.b. Test for autocorrelated errors.Above, a table was created to calculate the coefficients of the linear regression y=ax+b model for a data set using the least squares method. What is the coefficient a in this model?
- Explain with proof Least Squares Regression Unbiased Estimators y^For a least squares regression line, the sum of the residuals is __________. always negative sometimes positive and sometimes negative always zero always positiveThe data regarding the production of wheat in tons (X) and the price of the kilo of flour in Ghana cedis (Y) Takoradi some years ago were: a. Fit the regression line for the day using the method of least squares
- Prove the result that the R^2 associated with a restricted least squares estimator is never larger than that associated with the unrestricted least squares estimator. Conclude that imposing restrictions never improves the fit of the regression.An owner of a home in the Midwest installed solar panels to reduce heating costs. After installing the solar panels, he measured the amount of natural gas used y (in cubic feet) to heat the home and outside temperature x (in degree-days, where a day's degree-days are the number of degrees its average temperature falls below 65° F) over a 23-month period. He then computed the least-squares regression line for predicting y from x and found it to be ŷ = 85 + 16x. The software used to compute the least-squares regression line for the equation above says that r2 = 0.98. This suggests which of the following? 1. Gas used increases by square root of 0.98 = 0.99 cubic feet for each additional degree-day? 2. Although degree-days and gas used are correlated, degree-days do not predict gas used very accurately. 3. Prediction of gas used from degree-days will be quite accurate.What types of independent variables—binary or continuous—may interactwith one another in a regression? How do you interpret the coefficient on theinteraction between two continuous regressors and two binary regressors?
- Carbon dioxide (CO,) is produced by burning fossil fuels such as oll and natural gas, and has been connected to global warming. The following table presents the average amounts (in metric tons) of COy emissions for certain years per person in the United States and per person in the rest of the world. Use a TI-84 calculator to answer the following, (a) Compute the least-squares regression line for predicting U.S. emissions from non-U.S. emissions. Round the slope and y-intercept values to four decimal places.An experiment was performed on a certain metal to determine if the strength is a function of heating time. Results based on 10 metal sheets are given below. ∑ X = 30 ∑ X 2 = 104 ∑ Y = 40 ∑ Y 2 = 178 ∑ XY = 134 Using the simple linear regression model, find the estimated y-intercept and slope and write the equation of the least squares regression line.Suppose the simple linear regression model, Yi = β0 + β1 xi + Ei, is used to explain the relationship between x and y. A random sample of n = 12 values for the explanatory variable (x) was selected and the corresponding values of the response variable (y) were observed. A summary of the statistics is presented in the photo attached. Let b1 denote the least squares estimator of the slope coefficient, β1. What is the value of b1?
