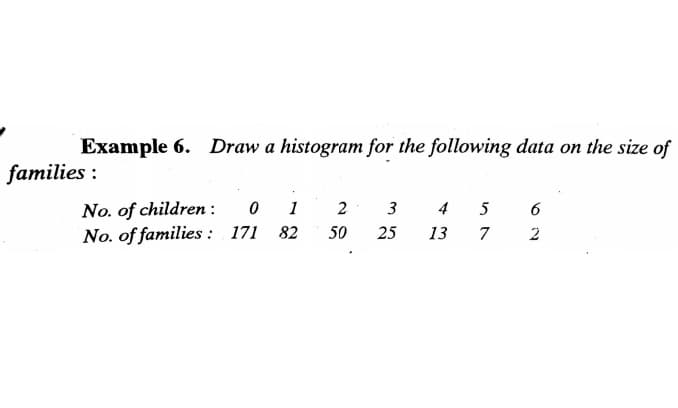
Example 6. Draw a histogram for the following data on the size of families : No. of children : No. of families : 171 82 1 3 4 5 6 50 25 13 7 2
Example 6. Draw a histogram for the following data on the size of families : No. of children : No. of families : 171 82 1 3 4 5 6 50 25 13 7 2

Functions and Change: A Modeling Approach to College Algebra (MindTap Course List)
6th Edition
ISBN:9781337111348
Author:Bruce Crauder, Benny Evans, Alan Noell
Publisher:Bruce Crauder, Benny Evans, Alan Noell
Chapter5: A Survey Of Other Common Functions
Section5.3: Modeling Data With Power Functions
Problem 6E: Urban Travel Times Population of cities and driving times are related, as shown in the accompanying...

Related questions
Question
Transcribed Image Text:Example 6. Draw a histogram for the following data on the size of
families :
No. of children :
No. of families : 171
1
2
3
4
5
6
50
25
13
7
2
Expert Solution
This question has been solved!
Explore an expertly crafted, step-by-step solution for a thorough understanding of key concepts.

Step by step
Solved in 2 steps with 1 images

Recommended textbooks for you
Functions and Change: A Modeling Approach to Coll…
Algebra
ISBN:
9781337111348
Author:
Bruce Crauder, Benny Evans, Alan Noell
Publisher:
Cengage Learning
Functions and Change: A Modeling Approach to Coll…
Algebra
ISBN:
9781337111348
Author:
Bruce Crauder, Benny Evans, Alan Noell
Publisher:
Cengage Learning