Example 9.25 The following table gives the distribution of height status among the management train- ees in Delhi. Height in Inches Number of Trainees 2 10 11 38 57 93 106 126 109 87 75 23 9 4 Test the normality of distribution by comparing the proportion of cases lying between X ± 10, X 20. X ± 30 for the distribution and for the normal curve. PERFECT8RFNN 61 62 63 64 65 66 67 68 69 70 71 72 73 74
Example 9.25 The following table gives the distribution of height status among the management train- ees in Delhi. Height in Inches Number of Trainees 2 10 11 38 57 93 106 126 109 87 75 23 9 4 Test the normality of distribution by comparing the proportion of cases lying between X ± 10, X 20. X ± 30 for the distribution and for the normal curve. PERFECT8RFNN 61 62 63 64 65 66 67 68 69 70 71 72 73 74

Glencoe Algebra 1, Student Edition, 9780079039897, 0079039898, 2018
18th Edition
ISBN:9780079039897
Author:Carter
Publisher:Carter
Chapter10: Statistics
Section10.4: Distributions Of Data
Problem 19PFA

Related questions
Question
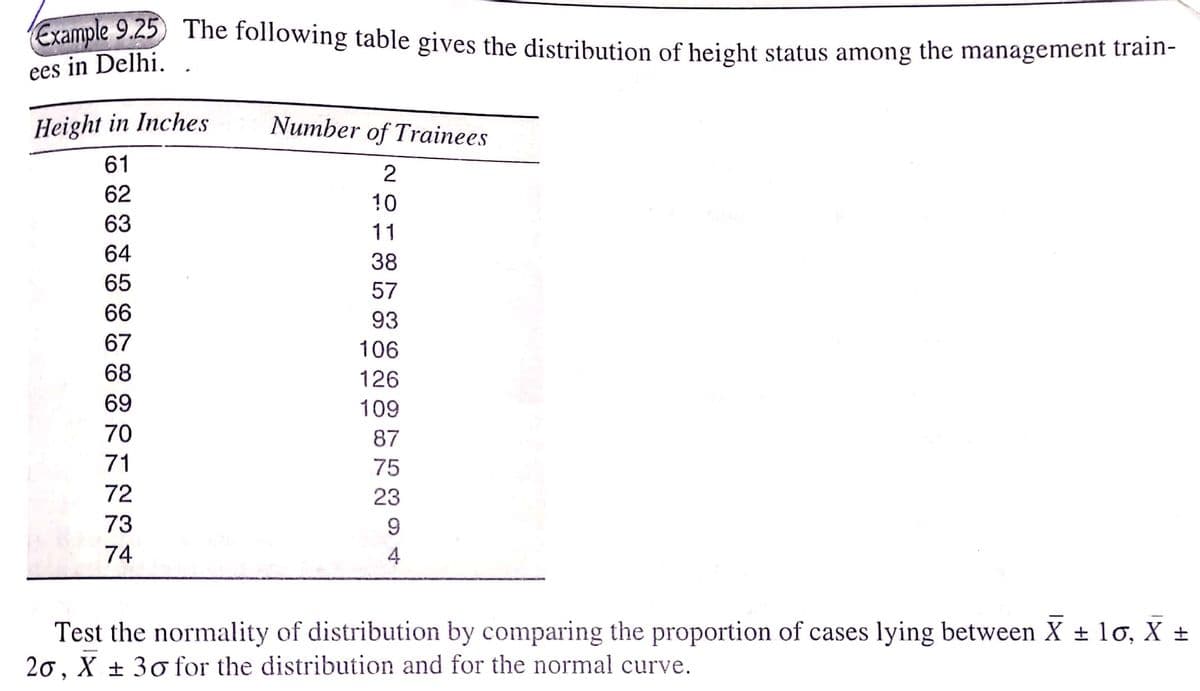
Transcribed Image Text:Example 9.25 The following table gives the distribution of height status among the management train-
ees in Delhi.
Height in Inches
Number of Trainees
61
2
62
10
63
11
64
38
65
57
66
93
67
106
68
126
69
109
70
87
71
75
72
23
9
4
Test the normality of distribution by comparing the proportion of cases lying between X ± 10, X ±
20, X ± 30 for the distribution and for the normal curve.
元 73 74
Expert Solution
This question has been solved!
Explore an expertly crafted, step-by-step solution for a thorough understanding of key concepts.

Step by step
Solved in 3 steps with 3 images

Recommended textbooks for you
Glencoe Algebra 1, Student Edition, 9780079039897…
Algebra
ISBN:
9780079039897
Author:
Carter
Publisher:
McGraw Hill
Glencoe Algebra 1, Student Edition, 9780079039897…
Algebra
ISBN:
9780079039897
Author:
Carter
Publisher:
McGraw Hill