Example A study is côna ne effectiveness of a new drug in treating the symptoms associated with a certain illness. 2,500 volunteers are selected for the study and they are divided into two groups of 1,250 patients each. During the course of the study some patients withdraw from the study, others are taken out for medical complications, and others die. At the end of the study there were 1,180 patients in the placebo group and 1,047 in the drug group. Interviews with the patients and medical exams were performed to determine if the symptoms improved, or if on the contrary, they worsen or stayed the same. The results are given in Table 4.11. Symptoms\ Group Placebo Drug
Example A study is côna ne effectiveness of a new drug in treating the symptoms associated with a certain illness. 2,500 volunteers are selected for the study and they are divided into two groups of 1,250 patients each. During the course of the study some patients withdraw from the study, others are taken out for medical complications, and others die. At the end of the study there were 1,180 patients in the placebo group and 1,047 in the drug group. Interviews with the patients and medical exams were performed to determine if the symptoms improved, or if on the contrary, they worsen or stayed the same. The results are given in Table 4.11. Symptoms\ Group Placebo Drug

Linear Algebra: A Modern Introduction
4th Edition
ISBN:9781285463247
Author:David Poole
Publisher:David Poole
Chapter2: Systems Of Linear Equations
Section2.4: Applications
Problem 28EQ

Related questions

Question
Repeat the analysis of the clinical study in Example 4.4.8 on page 155 using a confidence level of 95%. What conclusion can you draw about the effectiveness of the drug?
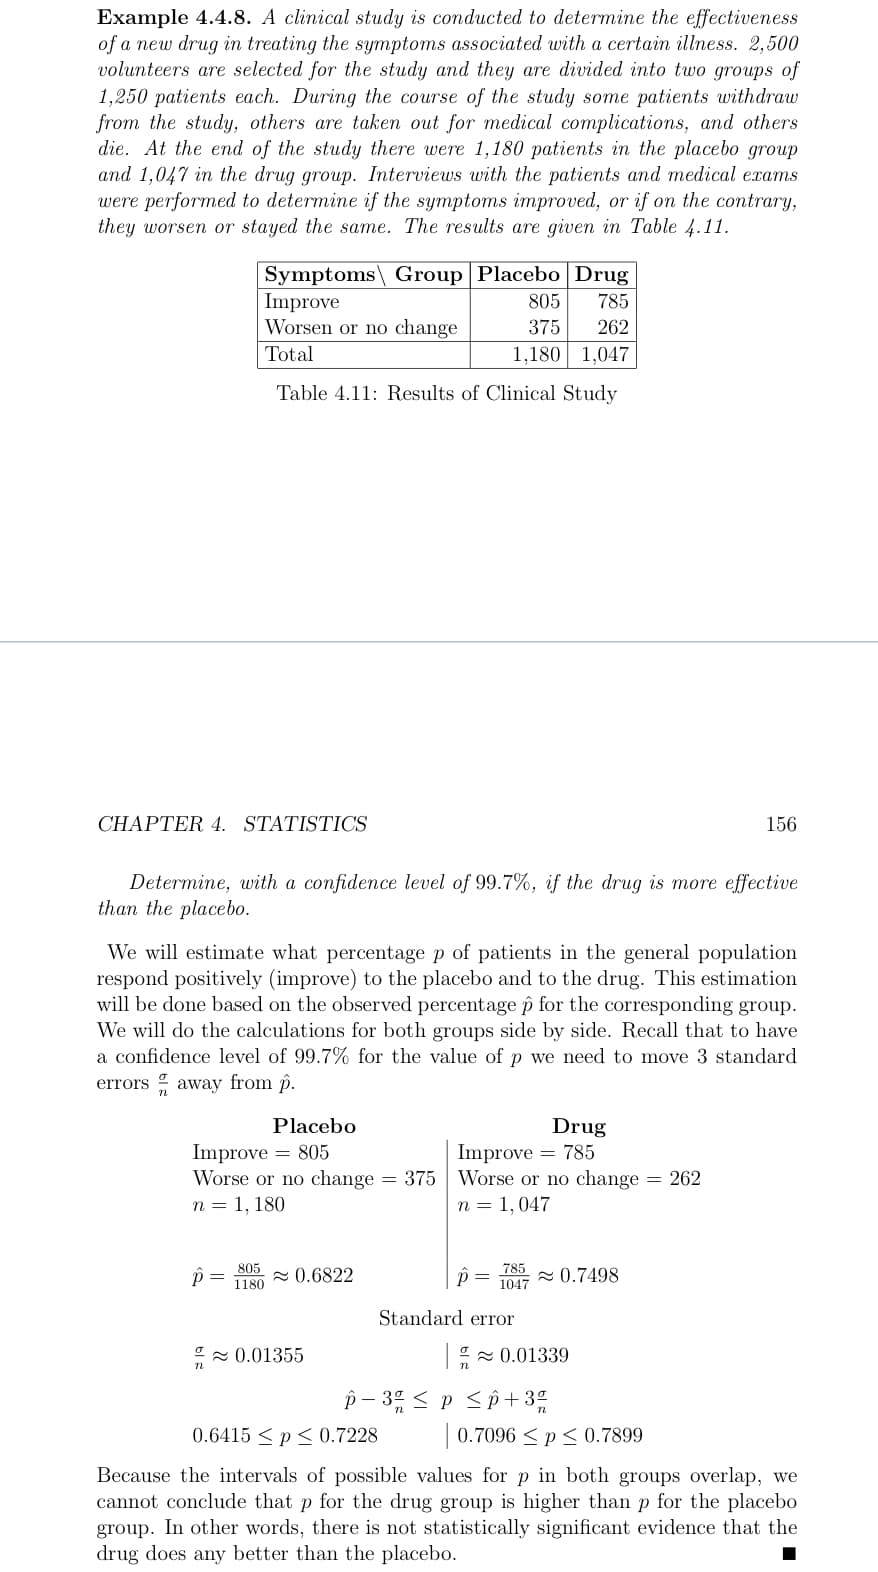
Transcribed Image Text:Example 4.4.8. A clinical study is conducted to determine the effectiveness
of a new drug in treating the symptoms associated with a certain illness. 2,500
volunteers are selected for the study and they are divided into two groups of
1,250 patients each. During the course of the study some patients withdraw
from the study, others are taken out for medical complications, and others
die. At the end of the study there were 1,180 patients in the placebo group
and 1,047 in the drug group. Interviews with the patients and medical exams
were performed to determine if the symptoms improved, or if on the contrary,
they worsen or stayed the same. The results are given in Table 4.11.
Symptoms\ Group Placebo Drug
Improve
Worsen or no change
805
785
375
262
Total
1,180 1,047
Table 4.11: Results of Clinical Study
CHAPTER 4. STATISTICS
156
Determine, with a confidence level of 99.7%, if the drug is more effective
than the placebo.
We will estimate what percentage p of patients in the general population
respond positively (improve) to the placebo and to the drug. This estimation
will be done based on the observed percentage p for the corresponding group.
We will do the calculations for both groups side by side. Recall that to have
a confidence level of 99.7% for the value of p we need to move 3 standard
errors away from p.
Placebo
Improve
Worse or no change = 375
Drug
Improve = 785
Worse or no change = 262
= 805
n = 1, 180
n = 1,047
785
1047
805
2 0.6822
2 0.7498
1180
Standard error
2 0.01355
I- 0.01339
p – 3° < p <p+3º
0.6415 < p < 0.7228
0.7096 < p< 0.7899
Because the intervals of possible values for p in both groups overlap, we
cannot conclude that p for the drug group is higher than p for the placebo
group. In other words, there is not statistically significant evidence that the
drug does any better than the placebo.
Expert Solution
This question has been solved!
Explore an expertly crafted, step-by-step solution for a thorough understanding of key concepts.

Step by step
Solved in 3 steps with 1 images

Knowledge Booster


Learn more about
Need a deep-dive on the concept behind this application? Look no further. Learn more about this topic, statistics and related others by exploring similar questions and additional content below.Recommended textbooks for you
Linear Algebra: A Modern Introduction
Algebra
ISBN:
9781285463247
Author:
David Poole
Publisher:
Cengage Learning

Functions and Change: A Modeling Approach to Coll…
Algebra
ISBN:
9781337111348
Author:
Bruce Crauder, Benny Evans, Alan Noell
Publisher:
Cengage Learning

Glencoe Algebra 1, Student Edition, 9780079039897…
Algebra
ISBN:
9780079039897
Author:
Carter
Publisher:
McGraw Hill
Linear Algebra: A Modern Introduction
Algebra
ISBN:
9781285463247
Author:
David Poole
Publisher:
Cengage Learning
Functions and Change: A Modeling Approach to Coll…
Algebra
ISBN:
9781337111348
Author:
Bruce Crauder, Benny Evans, Alan Noell
Publisher:
Cengage Learning
Glencoe Algebra 1, Student Edition, 9780079039897…
Algebra
ISBN:
9780079039897
Author:
Carter
Publisher:
McGraw Hill
