Example: Find the theoretical values for linear equation (y) from the given data a=0.0445, b=3.48, Sol: yi= a Xi + b Xi 6 8 10 12 14 16 18 20 22 24 Yi 3.8 3.7 4 3.9 4.3 4.2 4.2 4.4 4.5 4.5 yi 3.747 3.836 3.925 4.014 4.103 4.192 4.281 4.37 4.459 4.548
Example: Find the theoretical values for linear equation (y) from the given data a=0.0445, b=3.48, Sol: yi= a Xi + b Xi 6 8 10 12 14 16 18 20 22 24 Yi 3.8 3.7 4 3.9 4.3 4.2 4.2 4.4 4.5 4.5 yi 3.747 3.836 3.925 4.014 4.103 4.192 4.281 4.37 4.459 4.548

Functions and Change: A Modeling Approach to College Algebra (MindTap Course List)
6th Edition
ISBN:9781337111348
Author:Bruce Crauder, Benny Evans, Alan Noell
Publisher:Bruce Crauder, Benny Evans, Alan Noell
Chapter3: Straight Lines And Linear Functions
Section3.4: Linear Regression
Problem 12SBE: Find the equation of the regression line for the following data set. x 1 2 3 y 0 3 4

Related questions
Question
i need the answer quickly
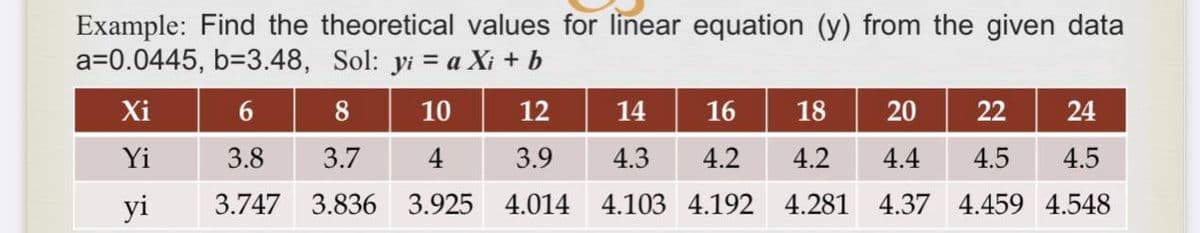
Transcribed Image Text:Example: Find the theoretical values for linear equation (y) from the given data
a=0.0445, b=3.48, Sol: yi = a Xi + b
Xi
6
8
10
12
14
16 18
20 22 24
Yi
3.8
3.7
4
3.9
4.3 4.2 4.2
4.4 4.5 4.5
yi
3.747 3.836 3.925
4.014
4.103 4.192
4.281 4.37 4.459 4.548
Expert Solution
This question has been solved!
Explore an expertly crafted, step-by-step solution for a thorough understanding of key concepts.

Step by step
Solved in 2 steps

Recommended textbooks for you
Functions and Change: A Modeling Approach to Coll…
Algebra
ISBN:
9781337111348
Author:
Bruce Crauder, Benny Evans, Alan Noell
Publisher:
Cengage Learning

Algebra: Structure And Method, Book 1
Algebra
ISBN:
9780395977224
Author:
Richard G. Brown, Mary P. Dolciani, Robert H. Sorgenfrey, William L. Cole
Publisher:
McDougal Littell

Algebra & Trigonometry with Analytic Geometry
Algebra
ISBN:
9781133382119
Author:
Swokowski
Publisher:
Cengage
Functions and Change: A Modeling Approach to Coll…
Algebra
ISBN:
9781337111348
Author:
Bruce Crauder, Benny Evans, Alan Noell
Publisher:
Cengage Learning
Algebra: Structure And Method, Book 1
Algebra
ISBN:
9780395977224
Author:
Richard G. Brown, Mary P. Dolciani, Robert H. Sorgenfrey, William L. Cole
Publisher:
McDougal Littell
Algebra & Trigonometry with Analytic Geometry
Algebra
ISBN:
9781133382119
Author:
Swokowski
Publisher:
Cengage