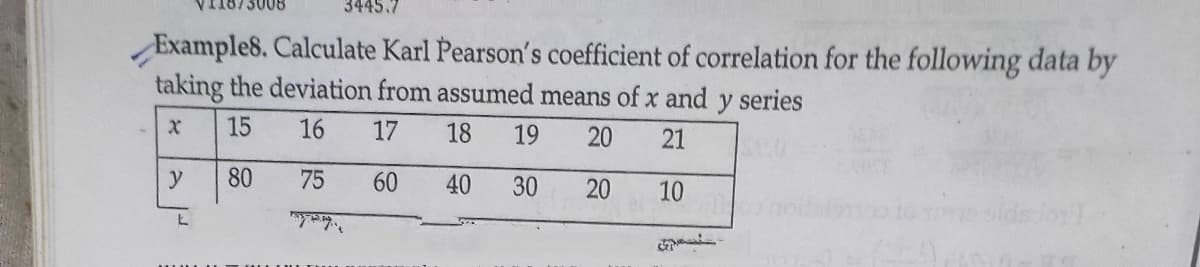
Example8. Calculate Karl Pearson's coefficient of correlation for the following data by taking the deviation from assumed means of x and y series 15 16 17 18 19 20 21 y 80 75 60 40 30 20 10


Q: Is there a significant linear correlation between the following variables (x and y)? Subject ID 1…
A: Here, x y x-x y-y (x-x)(y-y) (x-x)2 (y-y)2 10 20 -10.1429 -21.1429 214.4503 102.8784 447.0222…
Q: For the following scores, X Y 1 6 4 1 1 4 1 3 3 1 a. Sketch a scatter plot and estimate the value…
A: a) Step-by-step software procedure to draw scatter plot using Excel software is given below: Enter…
Q: For the scatterplot shown below, what can you say about the correlation? 800 700 600 500 400 300 200…
A: Given: The scatterplot is given and we need to say about its correlation.
Q: You are presented with the following data: Time spent doing homework/day (X) 0 0 0 20 30 45 80 127…
A: The following information has been provided: X Y 0 90 0 40 0 120 20 45 30 60 45 27…
Q: If the coefficient of determination is equal to 1, then the correlation coefficient is a.
A: Given : The coefficient of determination is equal to 1
Q: :17. Calculate Coefficient of Correlation from the following data: 0.1 0.2 0.3 0.4 0.5 0.6 0.7…
A:
Q: For the following data set, calculate the Pearson correlation. XY 2|6 1 |2 3 4 О а. 0.5 О Б. 0.25 О…
A: Solution
Q: A study was done to look at the relationship between number of vacation days employees take each…
A:
Q: 10. 1.1 1.9 2.4 4.1 4.6 6. 8.1 8.3 9.1 9.8 y 10 25 41 261 439 2,041 18,271 22,130 | 56,151 119,550…
A: Given data: x y 1.1 10 1.9 25 2.4 41 4.1 261 4.6 439 6 2041 8.1 18271 8.3 22130…
Q: Two companies have the following sales results for a particular month. Company 1 Company 2 S 8000 S…
A: Here is given that, mean is 8000 and standard deviation is 500.
Q: Y g e ra 38. If covariance between X and Y variables is 10 and the variances of X and Y are…
A:
Q: For which of the following correlations would the data points be clustered most closely around the…
A:
Q: Example 17.12. If T1 and T2 are two unbiased estimators of y(0), having the same variance and p is…
A:
Q: A set of n = 15 pairs of scores (X and Y values) has SSX = 4, SSY = 25, and SP = 6. What is the…
A:
Q: The correlation between x and y in each of the following four visualizations is 0.82, yet you can…
A: Correlation measures the linear relationship between two continuous variables x and y. If the…
Q: e 11 Show that the correlation coefficient is independent of the origin of reference and the units…
A:
Q: The Pearson Correlation Coefficient for the following set of data is r = [A]. Carry your answer out…
A: Pearson Correlation coefficient is given by,
Q: Calculate Karl Pearson' s coefficient of correlation from the following data : 31 24 28 18 20 X: 6.…
A:
Q: For the following set of data, X Y 1 0 2…
A: Here we've given the following data. It is asked to find Sketch a graph showing the location of…
Q: Calculate Karl Pearson's coefficient of correlation for the following date. 24 29 19 14 30 19 27 30…
A:
Q: Example 16.1 Calculate the coefficient of correlation for the following data: X 2 3 4 5 7 9 10 14 Y…
A:
Q: If the correlation coefficient between number of years of experience of an employee and the monthly…
A: Given data: r= 0.814 So coefficient of determination= (0.814)^2 = 0.6626
Q: Lablixoy if 2 = ax + by and r is the correlation cofficient between the two that is x and y. you…
A: Since you have asked multiple question, according to our guidelines we will solve the first question…
Q: A biologist looked at the relationship between number of seeds a plant produces and the percent of…
A: Since you have posted a question with multiple sub-parts, we will solve first three sub- parts for…
Q: 1) Given the following observations, determine the Pearson correlation coefficient. X 5 -1 3 4 y 10…
A: Solution: 1. From the given information,
Q: 1. The following data show the number of years by which passenger jeepneys have been used and their…
A: We have given that, The data in the above table and significance level(α)= 0.01 Then, We will…
Q: (a) Following are the % figures of expenditure on clothing (in Rs. 100's) and entertainment (in Rs.…
A: Since you have asked multiple question, we will solve the first question for you. If you want any…
Q: - 16 Calculate Coefficient of Correlation from the following data: 0.1 0.2 0.3 0.4 0.5 0.6 0.7 X y…
A:
Q: giron semEs X1 and 5. The following table gives indices of industrial production of registered…
A:
Q: The table below gives the estimated world population (in billions) for various years. 1980 1990 1997…
A: Given data obtained as follows, x y x2 y2 x⋅y 1980 4400 3920400 19360000 8712000 1990 5100…
Q: Compute the pearson correlation.
A: It is an important part of statistics. It is widely used.
Q: A biologist looked at the relationship between number of seeds a plant produces and the percent of…
A: Seeds(x) Sprout(y) xy x2 y2 63 39.5 2488.5 3969 1560.25 49 47.5 2327.5 2401 2256.25 40…
Q: If the Pearson correlation coefficient (r) between two variables is 0.6, what's the proportion of…
A:
Q: ru 8.17. Compute Karl Pearson's coefficient of correlation between X and Y from the following…
A: We have given that, X 1 2 3 4 Y 1 4 9 16 Then, We will fine the Karl…
Q: A study was done to look at the relationship between number of vacation days employees take each…
A: You have post multiple sub parts. As per Bartleby rules, I am solving 3 sub parts. Please re-post…
Q: 55. Calculate the Pearson's coefficient of correlation from the following data by using 44 and 26…
A:
Q: A biologist looked at the relationship between number of seeds a plant produces and the percent of…
A:
Q: given by the following table: y X-4 -2 2 4 -2 0 0.25 0 0 -1 0 0.25 1 0.25 0|0 2 0.25 Find the…
A: Given: X -4 -2 2 4 total -2 0 0.25 0 0 0.25 Y -1 0 0 0 0.25 0.25 1…
Q: 5. Which of the following Pearson correlations shows the greatest strength or consistency of…
A: From given information we know that , Correlation (r) value is near by ±1 has the greatest strength…
Q: a 56. Calculate Karl Pearson's coefficient of correlation from the following dala : 30 Husband's Age…
A: We want to find the correlation by using karl Pearson.
Q: A study was done to look at the relationship between number of vacation days employees take each…
A: The independent variable is Vacation Days. The dependent variable is Sick Days. We have to test the…
Q: Example 5. Find the coefficient of correlation between the heights of brothers and sisters from the…
A:
Q: A study was done to look at the relationship between number of vacation days employees take each…
A: Note: Hi, thank you for the question. As per our company guideline we are supposed to answer only…
Q: What will be your comment for Karl Pearson’s correlation coefficient in following cases? a. 0.91 b.…
A: Here we comment using Karl Pearson correlation coefficient.
Q: 4 48. Compute Karl Pearson's coefficient of correlation from the following data and cciment on its…
A:
Q: 1. The figures in the following table give the number of criminal convictions and the number…
A:
Q: For the following scores, X Y 3 12 6 7 3 9 5 7 3 10 Compute the Pearson correlation.…
A: Given, X Y 3 12 6 7 3 9 5 7 3 10
Q: Data collected from a sample of 8 students relating study time (x in hours per week) and leisure…
A:
Q: A set of n = 5 pairs of X and Y values has SSX = 16, SSY = 4 and SP = 2. For these data, what is the…
A: Given:

Step by step
Solved in 2 steps with 2 images

- With respect to the use of correlation, which one of the following statements is false a.When both X and Y are measured on an ordinal scale, we use Spearman’s rho. b. When both X and Y are measured on a continuous scale, we use Pearson’s r. c.when both X and Y are measured on an ordinal scale, we use Pearson’s r. d.When the relationship between X and Y is curvilinear, we use the eta correlation coefficient.9. With a small sample, a single point can have a largeeffect on the magnitude of the correlation. To createthe following data, we started with the scores fromproblem 8 and changed the first X value from X 1to X 6.X Y6 64 11 41 33 1a. Sketch a scatter plot and estimate the value of thePearson correlation.b. Compute the Pearson correlation.Suppose you have a sample of size n for variables X and Y. The sample covariance of X and Y is Cov(X,Y) = 1,000, the sample standard deviation for X is Sx=20 and the sample standard deviation for Y is SY=75. What is the sample correlation coefficient, r?
- A set of n=38 pairs of x and y scores has SSx=150 SSy=25 Ex=50 Ey=160 and EXY=200.What is the Pearson correlation for these scores?Here is a bivariate data set.xy182425915011737106295223812246 Find the correlation coefficient and report it accurate to four decimal places. r =Find the Spearman‘s Rank Correlation and interpret the result of the following series: X 9 8 11 5 7 4 Y 12 8 11 7 6 5