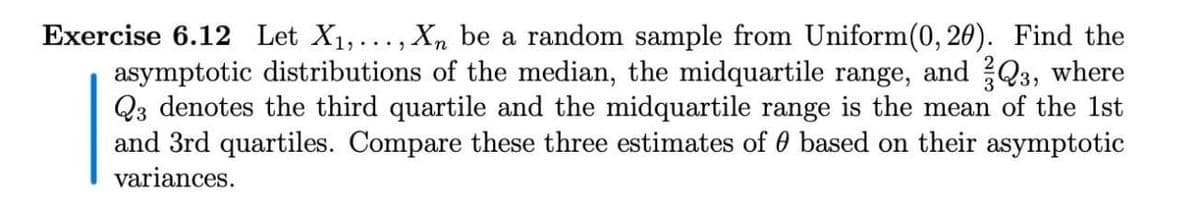
Exercise 6.12 Let X1,..., Xn be a random sample from Uniform(0, 20). Find the asymptotic distributions of the median, the midquartile range, and Q3, where Q3 denotes the third quartile and the midquartile range is the mean of the 1st and 3rd quartiles. Compare these three estimates of 0 based on their asymptotic variances.
Q: e round off errors when measuring the distance that a long jumper has jumped is uniformly tributed…
A: Note: According to Bartleby guidelines expert solve only one question and maximum 3 subpart of the…
Q: Consider the population described by the probability distribution shown in the table. The random…
A:
Q: SO the CLT ( Theorem ) says that when sample size n is taken from any population with the mean μ and…
A: Given: A sample drawn from the population having mean μ and standard deviation σ
Q: The Business College Computing Center wants to determine the proportion of business students who…
A:
Q: II. Direction Find the area under the t- distribution from t = -2.060 to t = 2.060 when n = 26, then…
A:
Q: Consider the following data sets. For each data set, decide whether the data are at the nominal…
A: Given that, consider the following data sets. For each data set, decide whether the data are at the…
Q: 4. Which of the following information should not be included in presenting the Research Literature…
A: In the given problem we have to answer the 4 objective questions.
Q: Say you roll two dice. Find the probability c rolling a number greater than 2 on the first, and then…
A:
Q: 18. It is a fact that C2 = 15. Demonstrate this explicitly by showing that there are 15 ways to…
A: The all possible combinations from six letters A B C D E F are :- A,BA,CA,DA,EA,FB,C
Q: 8. Which of the following is the given population standard deviation? А. 2 В. 2.58 С. 7 D. 99% 9.…
A: Given data is confidence level = 99%σ=7E=2
Q: First, draw the probability histogram of a single draw from a box that has 5 tickets, labeled as 2,…
A: The probability histogram compares the true probability of a random variable with the values that a…
Q: Scenario: A study was conducted to explore the prevalence and impact of sleep problems on various…
A: Given information: There is a sample of 271 respondents with 55% female and 45% male ranging in age…
Q: (ou are a researcher studying the lifespan of a certain species of bacteria. A preliminary sample of…
A:
Q: A lady on a diet measures her weight every week. The sample standard deviation is 0.7 kg, the number…
A: Given that Sample size=n=7 Sample standard deviation=S=0.7
Q: During randomization for sampling or experiment lay-outs, ensuring interspersionmeans: a. Repeating…
A:
Q: Locate the following percentile under the normal curve and find its corresponding t-value. Sketch…
A: The t-distribution is a type of continuous probability distribution that takes random values on the…
Q: From the following data find out (i) purchasing power of money, (ii) real income, and (iii) real…
A:
Q: From the following particulars chalk out an industrial activity index number for the year 1998…
A: For the given , particularl chalk out an industrial activity, we need to calculate the index number…
Q: You measure 23 dogs' weights, and find they have a mean weight of 68 ounces. Assume the population…
A:
Q: The Table below shows the average score of the150 students sampled from the North America University…
A: Class Frequency 40 - 49 19 50 - 59 32 60 - 69 49 70 - 79 29 80 - 89 21
Q: Roll 1 100.6:15= Roll 2 Roll 3 Roll 4 Roll S Average Your Mean of Averages: 7.10 1.2 6.6 1.8 7. 6.4…
A: Given Information: Theoretical population parameters: Population mean μ=7 Population standard…
Q: Complete the following worksheet and then use it to calculate the coefficient of determination. (ŷ;…
A: The formula to compute the coefficient of determination is, r2=∑(y⏞i-y)2∑(yi-y¯)2
Q: II. Use the z table to find the area that corresponds to each of the following. Sketch and label its…
A: We have to find area of given data by using z score table...
Q: Using your favorite statistics software package, you generate a scatter plot with a regression…
A: GivenThe regression equation(y)=20.41x+15.5correlation coefficient(r)=0.27
Q: Ten subjects were chosen for an experiment. They were asked to perform a certain physical activity.…
A: Null Hypothesis: H0: There is no sufficient evidence to indicate that the experiment condition…
Q: pls answer D full solution with all the sample means
A: Given The population has 6 elements as mentioned below: 6, 9, 12, 15, 18 and 21 Samples of size 5…
Q: The expected value and standard error of the proportion of groceries thrown out by your sample…
A: Here, proportion is 12% , ( 0.12). Sample is 540. We will use standard error for proportion.
Q: The probability density function of random variable X is given as: f(x) = {4 – Bx if 0 < x < 1…
A:
Q: A population has a normal distribution. A sample size of n is selected from this popuiation.…
A: Here Given From Normal Population Sample size n is selected
Q: The project manager has obtained a non-uniform distribution of resources all along the project. She…
A: The main demands of the Resource Planning Manager are: 1 to optimize the use of resources 2 to…
Q: In a gambling game, I roll two dice and win $1 if the sum of my two rolls is larger than 7. I lose…
A: Given, in a gambling game of rolling two dice and if the sum of two rolls is larger than 7, win $1.…
Q: i. What is the probability that a randomly selected subscription expiring at the end of the year was…
A: Here We will use Basics of Tree diagram and Byes thoerem
Q: measures the size of an effect in a population, whereas measures whether an effect exists in a…
A: We need to find, - ______measures the size of an effect in a population, whereas ________ measures…
Q: PROBLEM 1: A company claims that the mean weight per banana it ships is 160 grams with standard…
A:
Q: otherwise If the expected value of the random variable X is 1/3. Find the values A and B.
A: Here use property of probability distribution function
Q: An area has 12 rainfall measurement stations, and it is known that 2 of them are in damaged…
A: Given that, An area has 12 rainfall measurement stations, and it is known that 2 of them are in…
Q: Bonus +3 Find the probability of being dealt a flush in poker. This means that all five cards you're…
A:
Q: An energy company wants to choose between two regions in a state to install energy-producing wind…
A: Given that
Q: For numbers 9 to 11, The principal of Mapayapa Integrated National High School claimed average…
A: Given that Sample size n =15 Standard deviation =400
Q: Consider the following probability density distribution of random variable X. if 0<x<6 f(x) = }kx +…
A: To find the value of k we will use the fact that the integral of pdf f(x) over whole range of x is…
Q: According to the GSS 2018 dataset, 51% of 218 college graduates reported being interested in…
A:
Q: A company that sponsors LSAT prep courses would like to be able to claim that their courses improve…
A: There are two dependent samples which are initial test and post test. We have to find the test…
Q: 3.In a study, 924 of the 1200 surveyed individuals said that they are worried a great deal to…
A:
Q: Analysis of 300 randomly selected accounts receivable of a firm by an auditor show that 30 are…
A:
Q: In a study analyzed by the Statistics Consulting Center at Virginia Tech, a group of subjects was…
A: A T critical value is a “cut off point” on the t distribution. It’s almost identical to the Z…
Q: a) Show that the probability of the union of (non-mutually exclusive) events A and B can be written…
A: For any two events A and B, union of A and B is defined as the occurrence of either A or B or both.…
Q: The sampling distribution of p, the proportion of groceries thrown out by your sample respondents is…
A: Solution-: Given: n=540,p=0.12 (Or 12%) we choose correct option in the following (a) not normal…
Q: et X(1) 0. a) Show that X and X) - X() are independent for any s>r. p) Find the distribution of…
A:
Q:
A: Population standard deviations σ=5, n=sample size=30, sample mean x̄=75 Find 90% CI for population…
Q: Voting is done in a class consisting of 30 students to determine the study tour destination. One…
A: Given that, Voting is done in a class consisting of 30 students to determine the study tour…
Trending now
This is a popular solution!
Step by step
Solved in 3 steps
- In Exercise 4.2.27, in finding a confidence interval for the ratio of thevariances of two normal distributions, we used a statistic S21/S22, which has an Fdistributionwhen those two variances are equal. If we denote that statistic by F,we can test H0 : σ21 = σ22 against H1 : σ21 > σ22 using the critical region F ≥ c. Ifn = 13, m = 11, and α = 0.05, find c..A sample of 9 measurements, randomly selected from a normally distributed population, resulted in x= 2.6, and s= 0.9 Conduct a hypothesis test to verify the claim that the population mean is greater than 2.5 . Use a=.05A snack food manufacturer estimates that the variance of the number of grams of carbohydrates in servings of its tortilla chips is 1.34. A dietician is asked to test this claim and finds that a random sample of 16 servings has a variance of 1.22. At α=0.05, is there enough evidence to reject the manufacturer's claim? Assume the population is normally distributed. Complete parts (a) through (e) below.
- A researcher conducts an independent- measures research study and obtains t = 2.070 with df = 28. How many individuals participated in the entire research study? Using a two- tailed test with α = .05, is there a significant difference between the two treatment conditions? Compute r2 to measure the percentage of variance accounted for by the treatment effect.Suppose X, Y, Z are iid observations from a Poisson distribution with parameter λ, which is unknown. Consider the 3 estimators T1 = X + Y − Z, T2 = 2X + Y + Z 4 , T3 = 3X + Y + Z 5 . (a) Which among the above estimators are unbiased? (b) Among the class of unbiased estimators, which has the minimum variance?1a) Derive a maximum-liklihood estimator for the unknown parameter Y 1b) An experienced sales person completes sales following a Poisson distribution, with a mean rate of Y = 1.8 sales/month. A junior sales person completes sales at a mean rate of Y = 0.85 sales per month Find the probability of the joint sales team (experienced and junior) completing exactly 2 sales in any given months, assuming the two sales people act independently of each other. 1c) Find the probability of the joint sales team (experienced and junior) completing more than 2 sales in any given months