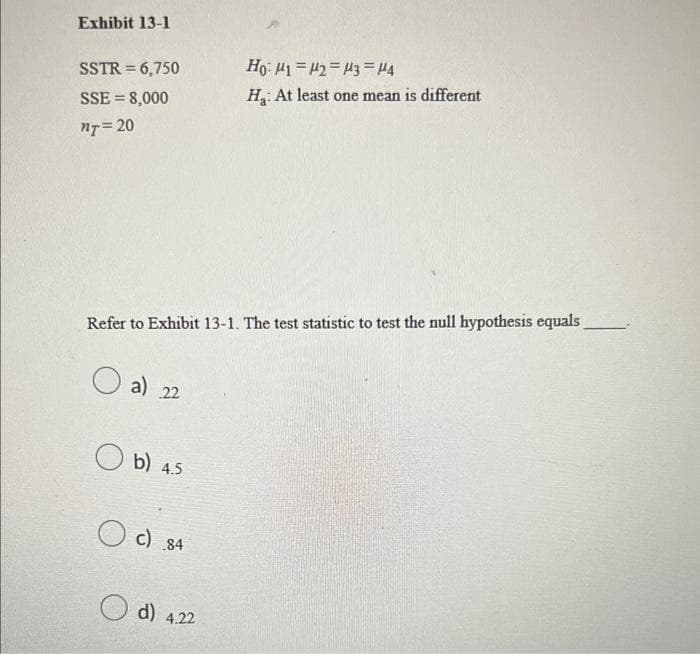
Exhibit 13-1 SSTR = 6,750 SSE = 8,000 nT=20 Refer to Exhibit 13-1. The test statistic to test the null hypothesis equals a) 22 b) 4.5 c) 84 Ho: 112=143=14 Ha: At least one mean is different d) 4.22


Q: Answer ALL questions Question 1 (a) Given the following information: A sample of 2000 claims…
A: (a) To find E[XA $7,000], we need to first calculate the number of claims that are greater than…
Q: Suppose a simple random sample of size n = 1000 is obtained from a population whose size is N=…
A: Given, n=1000, P=0.74, N=1,000,000 n P1-P=1000*0.74*1-0.74 n P…
Q: The graph illustrates a normal distribution for the prices paid for a particular model of HD…
A: The population mean is $1800 and standard deviation is $80. It is also given that the graph…
Q: What parameter would we put into our hypotheses if we are working with the Smk variable?
A: To identify the correct parameter for the given situation.
Q: The accompanying dataset shows the monthly number of new car sales in the last two years. Implement…
A: In this question, we are required to fit a Holt-Winters multiplicative seasonality model with trend…
Q: By using stepwise regression approach to build model. The following is the results when running…
A: For the provided models, it is set up: H01: The model with additional independent variable X3 does…
Q: A psychologist is studying the self image of smokers, which she measures by the self-image (SI)…
A: The standard deviation of the score 82; σ=85 Margin of error=20 At 99% confidence level; α=0.01
Q: A city expressway with four lanes in each direction was studied to see whether drivers preferred to…
A: It is given that, Lane Count 1 294 2 276 3 238 4 192 We have to write the…
Q: Imagine that the figure below represents two means with their respective 95% Cls in a paired design.…
A: It is required to estimate the approximate p-value, given the figure representing the 95% confidence…
Q: Use the normal distribution to find a confidence interval for a proportion p given the relevant…
A: given data p=0.9n = 130α = 0.01for 99 % CI,Zc:=Z0.01/2=Z0.0050=2.576 [ from excel function]
Q: Find z such that 95.1% of the standard normal curve lies to the right of z. (Round your answer to…
A: standard normal distribution Z~N(0,1) area under standard normal distribution represents…
Q: sion based on the ANOVA tab
A: To find the overall mean of the chlorine level across all the pools measured, we can calculate the…
Q: Suppose the heights of 18-year-old men are approximately normally distributed, with mean 70 inches…
A: The z score is used to measure the deviation of data set from the mean. It is calculated by the…
Q: MSC 600 Quantitative Methods 7. Part of an ANOVA table is shown below. Source of Variation Between…
A: dftreatment=3 , SStreatment=180 , dftotal=18 SStotal=480
Q: The following data are from an experiment designed to investigate the perception of corporate…
A: a. Using the given data, we can compute the following values: Total sample size, N = 18 Number of…
Q: What parameter would we put into our hypotheses if we are working with the Age variable? α μ P σ
A: Hypothesis is the statement that explain the claim of the research using the population parameter.…
Q: Number of Unlicensed Software Packages X 0 1 2 3 4 P(x) 0.008 0.076 0.265 0.412 0.240
A: Number of Unlicensed software packages(x) P(x) 0 0.008 1 0.076 2 0.265 3 0.412 4 0.240…
Q: (e) Find a 90% confidence interval for y when x = 4.5. (Round your answers to one decimal place.) mm…
A: x y x2 6.5 42.6 42.25 5.3 33.9 28.09 4.2 26.2 17.64 3.3 16.2 10.89 2.1 13.9 4.41 ∑x=21.4…
Q: Assume a significance level of α = 0.05 and use the given information to complete parts (a) and (b)…
A: We have given that α = 0.05 P-value = 0.0064
Q: Which of the following values cannot be probabilities? 0.06,-0.56, √2, 1, 1.54, 0, 5/3, 3/5 Select…
A: We know that the probabilities always falls between 0 and 1 Not negative
Q: Use the report to estimate the model.
A: From the given table, constant term is 12718. Coefficient of xt is 0.4405 Coefficient of Yt-1 is…
Q: different models of ergonomic pillow which helps to relief sore necks. It sells the delux and…
A: Step 1: Define the decision variables and objective function Let x be the number of containers of…
Q: a-1. Calculate the standard error for the sampling distribution of the sample proportion. (Do not…
A: Let p be the population proportion of teenagers who used cell phones while driving. Given that, p =…
Q: Based on the Cl for the difference you see in this figure, you know that in the NHST approach:…
A: The graph shows a horizontal line at the value of 0, representing no difference between the two…
Q: A probability experiment consists of rolling a six-sided die and spinning the spinner shown at the…
A: Six sided die and spinner (4 colours equally divided) 4 colours : (yellow,red, green,blue)…
Q: Use StatKey or other technology to generate a bootstrap distribution of sample proportions and find…
A: Answer Given Proportion= 0.257 sample size = 47
Q: The amount of time adults spend watching television is closely monitored by firms because this helps…
A: The mean of the sampling distribution is, μx¯=μ The standard deviation of the sampling distribution…
Q: Determine whether or not the procedure described below results in a binomial distribution. If it is…
A: Fixed number of trials: There are 600 trials, which is a fixed number. Independent trials: Each…
Q: 4. Find the raw score that corresponds to the following statement: 50% of the scores are above the…
A: The data is as follows: Population mean, μ=120 Population sd, σ=8
Q: A new drug has been developed to cure Ebola. Before it can be used, we need to make sure that the…
A: The appropriate alpha value for the researchers to use would depend on the level of risk they are…
Q: At , can the researcher conclude that there is a difference in the diets? State the correct…
A: Here dependent variable is weight gains in pounds. The weight gain is counted for three types of…
Q: A student is working on his science fair project. He hypothesizes that the average height of a…
A: Let X be the height of a certain native plant. From the given information, X follows normal…
Q: A random sample of 845 births included 435 boys. Use a 0.10 significance level to test the claim…
A:
Q: Topic: Understanding the Data Around Us Instructions: 1. Show your complete solutions and…
A: The distribution of blood type for the "general population" and the "50 sampled patients" are given…
Q: Define (a) subset contrast and (b) comparison, being sure to make clear how the two analysis types…
A: (a) Subset contrast refers to a type of analysis used in statistics and experimental design to…
Q: A regression diagnostic tool used to study the possible effects of collinearity is the slope. the…
A: It is needed to find the regression diagnostic tool used to study the possible effects of…
Q: A corporation has asked you to prepare some multiple regression equations to estimate the effect of…
A: The independent variables are Horsepower, Weight. The dependent variable is Miles. We have to find…
Q: Describe the sampling distribution of p. Assume the size of the population is 25,000. n=900 p=0.5…
A: N=25000n=900p=0.5we have to choose that best describes the shape of the sampling distribution of p
Q: The table shows the scores of 20 people who took a paramedics licensing test. Find the mean and…
A: From the provided information, Score (x) Frequency (f) 74 7 75 1 79 3 86 6 88 2 98 1…
Q: Assume a significance level of a = 0.05 and use the given information to complete parts (a) and (b)…
A: Given α=0.05P-value = 0.0064claim:The mean pulse rate of a certain group of adult males is 68 bpm
Q: t is the optim time for a scuba diver to be c the bottom of the ocean? That depends on the depth of…
A: x y 16.1 2.48 23.3 2.38 29.2 1.68 38.3 1.03 51.3 0.75 20.5 2.38 22.7 2.2 NOTE: Hi…
Q: Use the t-distribution to find a confidence interval for a mean given the relevant sample results.…
A:
Q: Month Sales 1 105 2 135 3 120 4 105 5 90 6 120 7 145 8 140 9 100 10 80 11 100 12 110…
A: To compute the exponential smoothing forecasts, we will use the formula: Ft+1 = α*At + (1-α) * Ft…
Q: The data table contains waiting times of customers at a bank, where customers enter a single waiting…
A: Let X=waiting times. X¯=∑Xn =6.2+7.5+....+6.8+6.960 =7.2217…
Q: According to the following table: Absolute l Frequency Rating excellent 7…
A: The measurement level of the variable in this table is ordinal. Ordinal variables have a natural…
Q: An STD clinic sees 10 people an hour. The actual probability of someone having an STD is 30%. What…
A: As per guidelines i have calculated first main question , as all questions are different . Here…
Q: I have a width of at m
A:
Q: A group of 14 students' cholesterol levels are tested. Suppose the probability of a student having a…
A: n=14 students cholesterol levels are testedp(student having a healthy cholesterol…
Q: How is a confidence level determined? It is selected O It is calculated depending on which test…
A: The confidence level in statistics denotes the likelihood that an estimate of the location of a…
Q: Two brands of refrigerators, denoted A and B are each guaranteed for 1 year. In a random sample of…
A: From the provided information, n1=50x1=12n2=60x2=12 Confidence level = 90%


Trending now
This is a popular solution!

Step by step
Solved in 3 steps

- Please answer the three empty boxes and "Perform a paired t test. Let μ1 be the population mean adindex rating for cola A and let μ2 be the population mean adindex rating for cola B. What are the null and alternative hypotheses?"The dean of a major university claims that the mean number of hours students study at her university (per day) is at most 5.6 hours. If a hypothesis test is performed, how should a decision that fails to reject the null hypothesis be interpreted?A weatherman stated that the average temperature during July in Baguio City is less than 20 degrees Celsius. A sample of 32 Julys is taken. The correct set of hypotheses is __________.
- The dean of a major university claims that the mean number of hours students study at her University (per day) is at most 4.4 hours. If a hypothesis test is performed, how should you interpret a decision that fails to reject the null hypothesis? a.There is sufficient evidence to reject the claim μ ≤ 4.4. b.There is not sufficient evidence to reject the claim μ ≤ 4.4. c.There is not sufficient evidence to support the claim μ ≤ 4.4. d.There is sufficient evidence to support the claim μ ≤ 4.4.local chess club claims that the length of time to play a game has a mean of 58 minutes or more. Write sentences describing type I and type II errors for a hypothesis test of this claim.For the given scenario, determine the type of error that was made, if any. (Hint: Begin by determining the null and alternative hypotheses.) Researchers state 2.52.5 hours as the mean amount of television watched by children per night. One parent claims that the mean amount of television watched by children per night is less than 2.52.5 hours. The parent conducts a hypothesis test and rejects the null hypothesis. Assume that in reality, the mean amount of television watched by children per night is 2.52.5 hours. Was an error made? If so, what type?
- A sample of 100 flounder have a sample mean weight of 21.5 grams. Scientists wish to perform a hypothesis test to determine if the mean weight differs from 20 grams. State the appropriate null and alternative hypotheses.Please solve these subparts of the attached image question manually and using R-studio code, not an excel output. Thanks so much! a) We want to test if there is a difference in the mean heart rates for the three groups. Give the null hypothesisof this test. b) Does the data suggest that there is a difference among the three groups? Use α = 0.05.c) If there seems to be a difference, complete a Bonferroni pairwise test to determine which or if all the meansare different from each other.The mean weight of all kangaroos is less than 200 pounds. State the null and alternative hypothesis. µ ≥ 200 µ < 200
- Following an oil spill, a particular region of the ocean is being tested for the level of a chemical called naphthalene. It is considered fact that fish from the region will be safe to eat if, and only if, the mean naphthalene level in the region is less than 3.3 parts per billion. A set of water specimens will be randomly selected from the region and tested, and if the results provide convinving evidence that the mean naphthalene level is less than 3.3, then the sale of fish from the region will be made legal. Which of the following describes a Type I error and its consequences? A) the authorities fail to obtain convincing evidence that the mean naphthalene level is less than 3.3, and do not legalize the sale of fish from the region when in fact the fish are SAFE for consumption. B) The definition of a Type I error depends on the actual results of the study in question C) The authorities fail to obtain convincing evidence that the mean naphthalene level is less than 3.3, and do not…A vehicle is advertised as having a gas mileage rating of at least 30 miles/gallon in highway driving. The miles per gallon obtained in 10 independent experiments are: 24, 25, 26, 20, 27, 25, 28, 26, 30, 33 For the null hypotheses µ ≥ 30, what is the significance level at which it can be accepted?The mean age of lawyers in New York is 50.7 years. A) Null and alternative hypotheses B) Indicate whether the the hypothesis is left, right, or two tailed