EXHIBIT 4.55.1 Majestic (percent) Industry (percent) Analytical Procedure Documentation Sales: Rooms 60.4% 63.9% Food and beverage 35.7 32.2 Other 3.9 3.9 Costs: Rooms department Food and beverage Administrative and general Management fee Advertising 15.2 17.3 34.0 27.2 8.0 8.9 3.3 1.1 2.7 3.2 Real estate taxes 3.5 3.2 Utilities, repairs, maintenance Profit per sales dollar Rooms dept. ratios to room sales dollars: Salaries and wages Laundry 15.9 13.7 17.4 25.4 18.9 15.7 1.1 3.7 Other 5.3 7.6 Profit per rooms sales dollar Food/beverage (F/B) ratios to F/B sales dollars: 74.8 73.0 Cost of food sold 42.1 37.0 Food gross profit Cost of beverages sold Beverages gross profit Combined gross profit Salaries and wages 57.9 63.0 43.6 29.5 56.4 70.5 57.7 64.6 39.6 32.8 Music and entertainment 2.7 Other 13.4 13.8 Profit per F/B sales dollar Average annual percent of rooms occupied Average room rate per day Number of rooms available per day 4.7 15.3 62.6 68.1 $160 $120 200 148

College Accounting, Chapters 1-27
23rd Edition
ISBN:9781337794756
Author:HEINTZ, James A.
Publisher:HEINTZ, James A.
Chapter25: Departmental Accounting
Section: Chapter Questions
Problem 1MP: MASTERY PROBLEM Bobs Acme Supermarket has been in operation for many years, offering high-quality...
icon
Related questions
Question

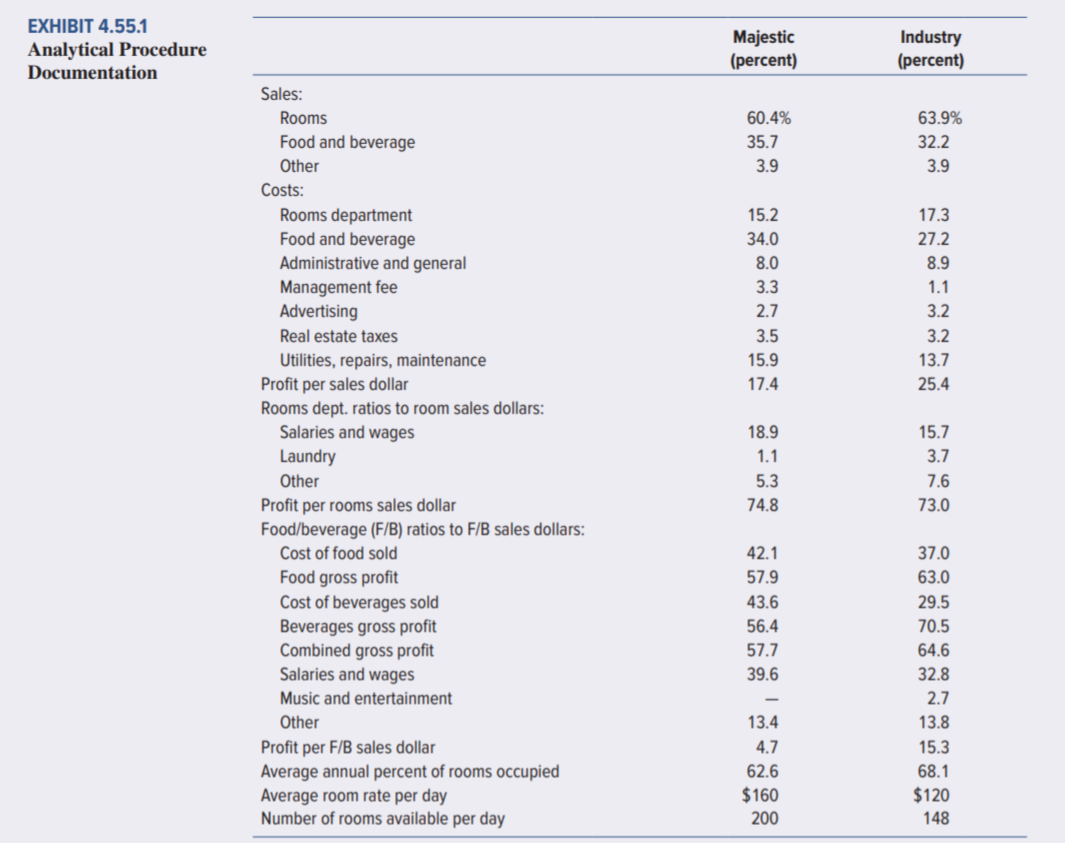
Kelly Griffin, an audit manager, had begun preliminary analytical procedures of selected statistics related to the Majestic Hotel. Her objective was to obtain an understanding of the hotel’s business in order to draft a preliminary audit plan. She wanted to see whether she could detect any troublesome areas or questionable accounts that could
require special audit attention. Unfortunately, Griffin caught the flu and was hospitalized. From her sickbed, she sent you the schedule she had prepared (Exhibit 4.55.1) and has asked you to write a memorandum identifying areas of potential misstatements or other matters that the preliminary audit plan should cover.

Check the below image for Exhibit 4.55.1

Required:
Write a memorandum describing Majestic’s operating characteristics compared to the industry average insofar as you can tell from the statistics. Do these analytical procedures identify any areas that could represent potential misstatements in the audit?

EXHIBIT 4.55.1
Majestic
(percent)
Industry
(percent)
Analytical Procedure
Documentation
Sales:
Rooms
60.4%
63.9%
Food and beverage
35.7
32.2
Other
3.9
3.9
Costs:
Rooms department
Food and beverage
Administrative and general
Management fee
Advertising
15.2
17.3
34.0
27.2
8.0
8.9
3.3
1.1
2.7
3.2
Real estate taxes
3.5
3.2
Utilities, repairs, maintenance
Profit per sales dollar
Rooms dept. ratios to room sales dollars:
Salaries and wages
Laundry
15.9
13.7
17.4
25.4
18.9
15.7
1.1
3.7
Other
5.3
7.6
Profit per rooms sales dollar
Food/beverage (F/B) ratios to F/B sales dollars:
74.8
73.0
Cost of food sold
42.1
37.0
Food gross profit
Cost of beverages sold
Beverages gross profit
Combined gross profit
Salaries and wages
57.9
63.0
43.6
29.5
56.4
70.5
57.7
64.6
39.6
32.8
Music and entertainment
2.7
Other
13.4
13.8
Profit per F/B sales dollar
Average annual percent of rooms occupied
Average room rate per day
Number of rooms available per day
4.7
15.3
62.6
68.1
$160
$120
200
148
Transcribed Image Text:EXHIBIT 4.55.1 Majestic (percent) Industry (percent) Analytical Procedure Documentation Sales: Rooms 60.4% 63.9% Food and beverage 35.7 32.2 Other 3.9 3.9 Costs: Rooms department Food and beverage Administrative and general Management fee Advertising 15.2 17.3 34.0 27.2 8.0 8.9 3.3 1.1 2.7 3.2 Real estate taxes 3.5 3.2 Utilities, repairs, maintenance Profit per sales dollar Rooms dept. ratios to room sales dollars: Salaries and wages Laundry 15.9 13.7 17.4 25.4 18.9 15.7 1.1 3.7 Other 5.3 7.6 Profit per rooms sales dollar Food/beverage (F/B) ratios to F/B sales dollars: 74.8 73.0 Cost of food sold 42.1 37.0 Food gross profit Cost of beverages sold Beverages gross profit Combined gross profit Salaries and wages 57.9 63.0 43.6 29.5 56.4 70.5 57.7 64.6 39.6 32.8 Music and entertainment 2.7 Other 13.4 13.8 Profit per F/B sales dollar Average annual percent of rooms occupied Average room rate per day Number of rooms available per day 4.7 15.3 62.6 68.1 $160 $120 200 148
Expert Solution
trending now

Trending now

This is a popular solution!

steps

Step by step

Solved in 3 steps with 4 images

Blurred answer
Knowledge Booster
Forensic Audits
Learn more about
Need a deep-dive on the concept behind this application? Look no further. Learn more about this topic, accounting and related others by exploring similar questions and additional content below.
Similar questions
  • SEE MORE QUESTIONS
Recommended textbooks for you
College Accounting, Chapters 1-27
Accounting
ISBN:
9781337794756
Author:
HEINTZ, James A.
Publisher:
Cengage Learning,
Corporate Financial Accounting
Accounting
ISBN:
9781337398169
Author:
Carl Warren, Jeff Jones
Publisher:
Cengage Learning
Survey of Accounting (Accounting I)
Accounting
ISBN:
9781305961883
Author:
Carl Warren
Publisher:
Cengage Learning
Financial & Managerial Accounting
Accounting
ISBN:
9781285866307
Author:
Carl Warren, James M. Reeve, Jonathan Duchac
Publisher:
Cengage Learning
Quickbooks Online Accounting
Accounting
ISBN:
9780357391693
Author:
Owen
Publisher:
Cengage