EXPERIMENT #1 Prednisone is a corticosteroid used to treat many inflammatory diseases such as asthma, ulcerative colitis, arthritis, or acne. However, prolonged use of the drug can cause patients to develop osteoporosis, low bone density. Recently a new drug, prednisolone has been developed that acts as anti-inflammatory with fewer side effects. To compare the drugs impact on bone density a study was done in which two groups of cats received equivalent doses of prednisone or prednisolone for an equivalent time period. At the end of the treatment period the bone density of both groups was measured. Each measurement represents an individual cat that was given either Prednisone or Prenisolone. Now the researchers want to use a t-test to see if the data show any differences between the treatments. Ho: There is no difference in the bone density between the two treatment groups HA: The prednisolone treatment group bone density is greater than the prednisone treatment group. Now you're going to determine the t-test probability Pt) using a t-test formula in a spreadsheet. To do this in Google Sheets, the formula is a little more detailed. This short video will show_you how, also this Google help dọc will help. Note: we are looking for t-test probability, not the t-test value. The t-test probability is based on a = 0.05 where we reject the null if it's alpha or below. 1) Is this a one-tailed or two-tailed test? (you'll want this information for the formula that you will use). Also, for the formula, assume unequal variance between treatment groups (specify type 3 t-test in your spreadsheet softv are) The data for Experiment #1 are located here: https://docs.google.com/spreadsheets/d/1MQtxcLvd7TSqPrE2j3mNXTBkO835-z89SsKa1jE4S60/copy. Using Google Sheets (or another spreadsheet if you have a favorite), calculate the t-test probability. 2) Copy and paste your calculated t-test probability here (to at least 3 significant figures): 3) Based on the t-test probability you would the null hypothesis. (reject, fail to reject) 4) Is it likely that the bone density of the prednisolone treatment group is greater than the prednisone treatment group?
EXPERIMENT #1 Prednisone is a corticosteroid used to treat many inflammatory diseases such as asthma, ulcerative colitis, arthritis, or acne. However, prolonged use of the drug can cause patients to develop osteoporosis, low bone density. Recently a new drug, prednisolone has been developed that acts as anti-inflammatory with fewer side effects. To compare the drugs impact on bone density a study was done in which two groups of cats received equivalent doses of prednisone or prednisolone for an equivalent time period. At the end of the treatment period the bone density of both groups was measured. Each measurement represents an individual cat that was given either Prednisone or Prenisolone. Now the researchers want to use a t-test to see if the data show any differences between the treatments. Ho: There is no difference in the bone density between the two treatment groups HA: The prednisolone treatment group bone density is greater than the prednisone treatment group. Now you're going to determine the t-test probability Pt) using a t-test formula in a spreadsheet. To do this in Google Sheets, the formula is a little more detailed. This short video will show_you how, also this Google help dọc will help. Note: we are looking for t-test probability, not the t-test value. The t-test probability is based on a = 0.05 where we reject the null if it's alpha or below. 1) Is this a one-tailed or two-tailed test? (you'll want this information for the formula that you will use). Also, for the formula, assume unequal variance between treatment groups (specify type 3 t-test in your spreadsheet softv are) The data for Experiment #1 are located here: https://docs.google.com/spreadsheets/d/1MQtxcLvd7TSqPrE2j3mNXTBkO835-z89SsKa1jE4S60/copy. Using Google Sheets (or another spreadsheet if you have a favorite), calculate the t-test probability. 2) Copy and paste your calculated t-test probability here (to at least 3 significant figures): 3) Based on the t-test probability you would the null hypothesis. (reject, fail to reject) 4) Is it likely that the bone density of the prednisolone treatment group is greater than the prednisone treatment group?

Linear Algebra: A Modern Introduction
4th Edition
ISBN:9781285463247
Author:David Poole
Publisher:David Poole
Chapter4: Eigenvalues And Eigenvectors
Section4.6: Applications And The Perron-frobenius Theorem
Problem 25EQ

Related questions

Question
Could you please highlight the correct answer. and explain it
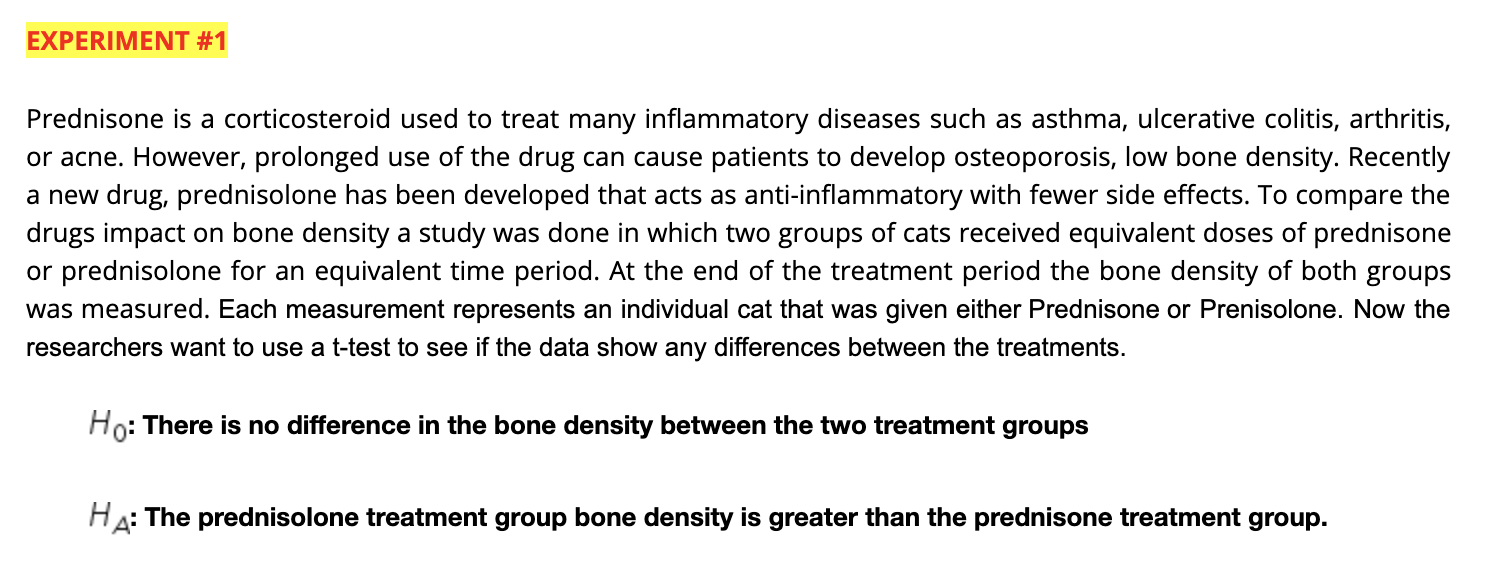
Transcribed Image Text:EXPERIMENT #1
Prednisone is a corticosteroid used to treat many inflammatory diseases such as asthma, ulcerative colitis, arthritis,
or acne. However, prolonged use of the drug can cause patients to develop osteoporosis, low bone density. Recently
a new drug, prednisolone has been developed that acts as anti-inflammatory with fewer side effects. To compare the
drugs impact on bone density a study was done in which two groups of cats received equivalent doses of prednisone
or prednisolone for an equivalent time period. At the end of the treatment period the bone density of both groups
was measured. Each measurement represents an individual cat that was given either Prednisone or Prenisolone. Now the
researchers want to use a t-test to see if the data show any differences between the treatments.
Ho: There is no difference in the bone density between the two treatment groups
HA: The prednisolone treatment group bone density is greater than the prednisone treatment group.
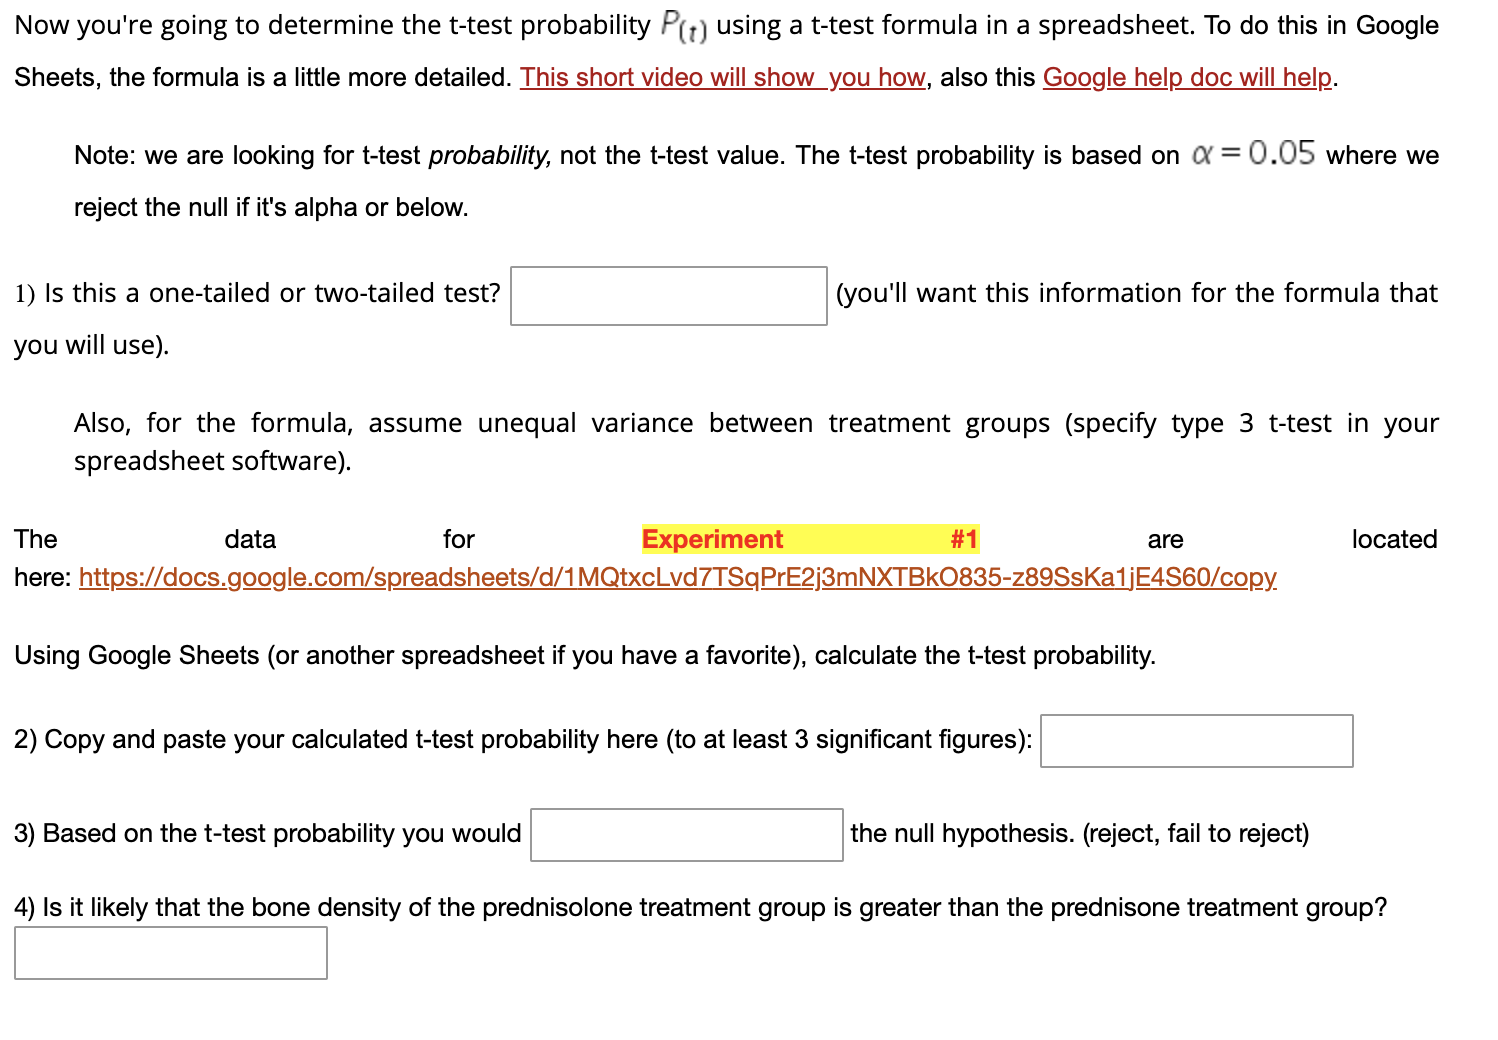
Transcribed Image Text:Now you're going to determine the t-test probability Pt) using a t-test formula in a spreadsheet. To do this in Google
Sheets, the formula is a little more detailed. This short video will show_you how, also this Google help dọc will help.
Note: we are looking for t-test probability, not the t-test value. The t-test probability is based on a = 0.05 where we
reject the null if it's alpha or below.
1) Is this a one-tailed or two-tailed test?
(you'll want this information for the formula that
you will use).
Also, for the formula, assume unequal variance between treatment groups (specify type 3 t-test in your
spreadsheet softv
are)
The
data
for
Experiment
#1
are
located
here: https://docs.google.com/spreadsheets/d/1MQtxcLvd7TSqPrE2j3mNXTBkO835-z89SsKa1jE4S60/copy.
Using Google Sheets (or another spreadsheet if you have a favorite), calculate the t-test probability.
2) Copy and paste your calculated t-test probability here (to at least 3 significant figures):
3) Based on the t-test probability you would
the null hypothesis. (reject, fail to reject)
4) Is it likely that the bone density of the prednisolone treatment group is greater than the prednisone treatment group?
Expert Solution
This question has been solved!
Explore an expertly crafted, step-by-step solution for a thorough understanding of key concepts.

This is a popular solution!

Trending now
This is a popular solution!

Step by step
Solved in 4 steps with 3 images

Knowledge Booster


Learn more about
Need a deep-dive on the concept behind this application? Look no further. Learn more about this topic, probability and related others by exploring similar questions and additional content below.Recommended textbooks for you
Linear Algebra: A Modern Introduction
Algebra
ISBN:
9781285463247
Author:
David Poole
Publisher:
Cengage Learning

Linear Algebra: A Modern Introduction
Algebra
ISBN:
9781285463247
Author:
David Poole
Publisher:
Cengage Learning