What are Confidence Intervals?
When we calculate intervals in probability and statistics, it can be simply termed as finding out a confidence interval. The confidence interval is usually calculated from the data set which is observed. The value of the parameter that needs to be calculated is present here only.
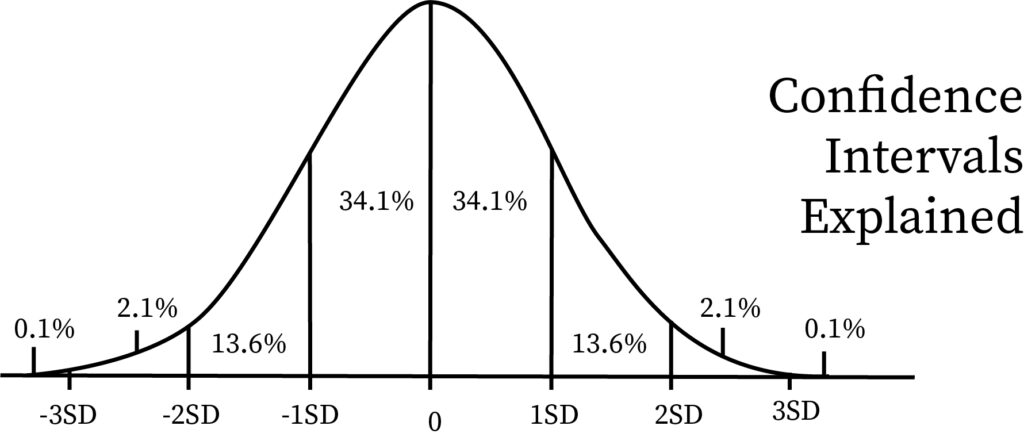
This unknown parameter is present in the confidence level, and the quantification of the confidence level is associated with finding out the confidence interval. Within the confidence interval, the proper parameter value also exists. If we want to describe confidence interval by the means of standard normal distribution, then it is the interval where the value of the z-score and Z value are equal.
What is the Definition of Confidence Interval?
The confidence interval is an estimate computed in statistics. It gives a range of values for the unknown parameter. We define confidence interval with the help of confidence level. When we state the confidence level, we mainly mean the confidence intervals that are accepted and how frequently they are considered. In other words, we find its probability. This is where the population parameter has its proper value. The evaluation of the confidence intervals is done with the help of the confidence level. This confidence level is acquired from unlimited samples which are independent in nature. Hence, the range proportion has the correct population parameter value, and the confidence level has the same value.
What is Meant by Confidence Level?
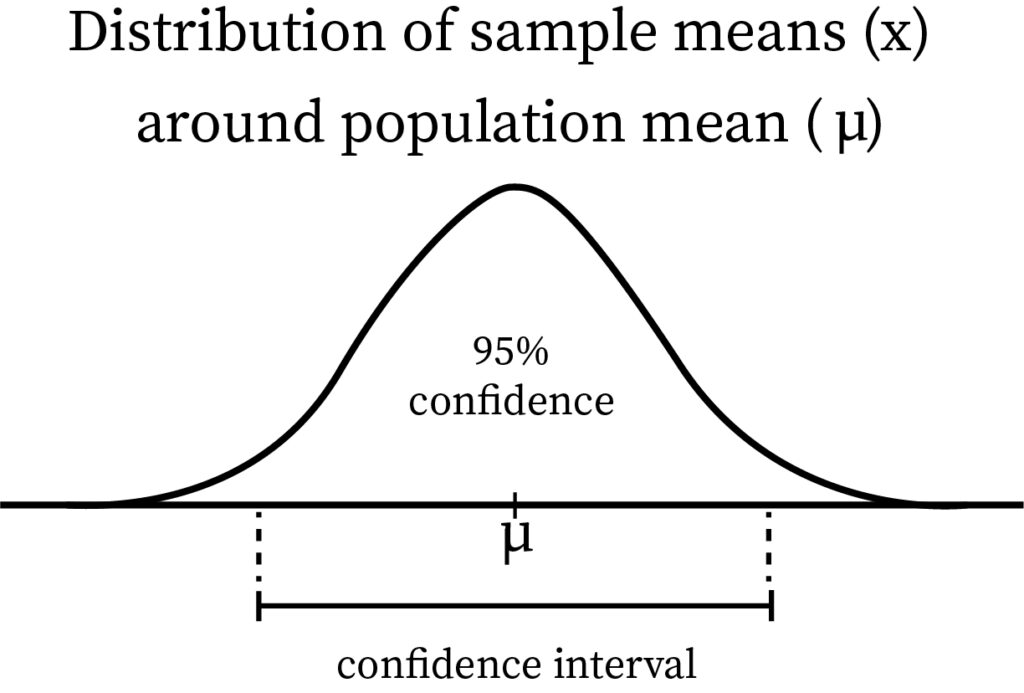
Usually, right before the data is examined, we select the confidence level. If nothing is given, a confidence level of 95% is considered to be normal. As the term suggests, the amount of surety that we get is described by the confidence level. In the taken confidence interval, the actual percentage that would give the desired outcome is expressed as confidence level. A confidence level of 95% means one can be certain up to that particular value. Other than the standard 95%, it has been seen that other confidence levels such as 99% and 90% are also used often.
When both confidence interval and confidence level are put together, the actual number of the desired results from the possible outcomes can be calculated. In a population, the correct percentage can be determined with the certainty of the confidence level.
What are the Factors by which Confidence Intervals are Affected?
The basis of the confidence interval lies in the error margin. For any confidence level which is given, three different factors can affect the confidence interval size. They are-
- Sample Size
- Percentage
- Population Size
What is Sample Size?
The sample size is the total space from which the desired results can be retrieved. Hence, if a sample has a large size, the better the chances are for the population to be reflected by the answers. As sample size and confidence interval are inversely related, hence with the increase in sample size, there is a decrease in the confidence interval. The inverse relation is, however, not linear. The sample mean is derived from it.
What is Percentage?
The accuracy of the result is also dependent on the percentage. By percentage, we mean the percentage of a particular answer getting picked. For example, if in a situation, there are 99% positive results in a sample, and 1% negative result, then no matter what is the size of the sample, there is a very low chance of any error. Similarly, if positive results consist of 60%, and negative results consist of 40%, then there are much higher chances of an error occurring. Hence, extreme answers can always be determined with much more surety.
Usually, when accuracy levels are given, and we need to find out the size of the sample, we generally use 50% for the worst case. For any acquired sample, 50% is also considered for finding out the usual accuracy level. In such cases, finding out the population mean, the sample mean, and population parameter can all be difficult. When the sample produces any specific answer, the confidence interval can be found out by choosing the percentage that corresponds to the answer. This way, a smaller interval can also be achieved.
What is Population Size?
The population size describes the total number of people from which the sample is chosen. In most cases, the population size is not known exactly. From probability, we know that the population size is usually not required. In rare cases, the sample exceeds in few percentages of the population. However, in most cases, the population size does not matter. However, that does not mean it can never be a factor. Generally, it is ignored. The population size is a factor only if the population size is very small. The population mean is calculated from the population size. The population mean is useful for calculating the confidence interval.
It is to note that the calculations related to confidence intervals are only valid when the sample chosen is actually random in nature. Confidence intervals are not reliable for non-random samples. This is because the generation of the non-random samples is due to flaws and errors.
Formula
The formula for the confidence interval is mainly dependent on the standard deviation and mean. It is given as follows-
Here, X̄ stands for the sample mean, Z denotes the confidence coefficient, α means the confidence level, σ stands for sample standard deviation, and the sample size is denoted by n.
The symbol ± is used, which signifies the margin of error in calculation.
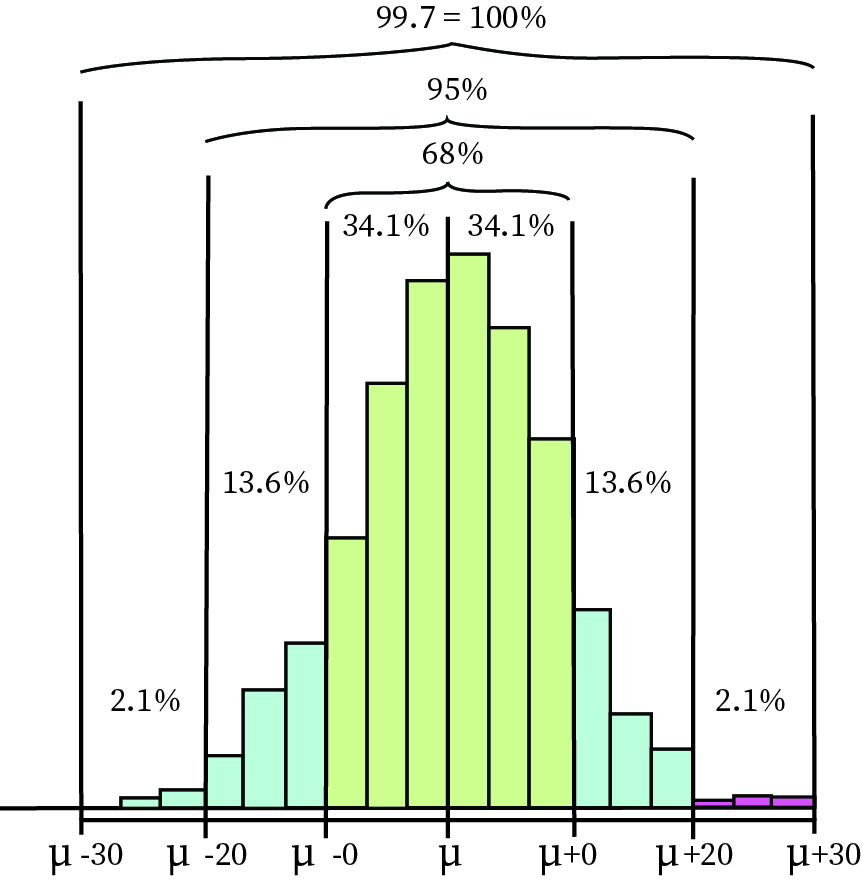
It is to note that only when a normal distribution describes the population, that this interval remains accurate. In a normal distribution, the accuracy of the confidence interval is the highest. When large samples are considered, usually taken from different population distributions, we use the central limit theorem to determine the accuracy of the interval.
What is the Confidence Interval Table?
The value of the confidence interval is generally expressed in terms of Z values. For this, a table of the confidence intervals is prepared. Here, the Z value corresponding to each confidence interval is given accurately. The table is as follows-
| Confidence Interval | Z Value |
| 80% | 1.282 |
| 85% | 1.440 |
| 90% | 1.645 |
| 95% | 1.960 |
| 99% | 2.576 |
| 99.5% | 2.807 |
| 99.9% | 3.291 |
How can the Confidence Interval be Calculated?
We usually calculate the confidence interval by the following steps-
- First, we need to determine the sample space, mean, along with standard deviation.
- After that, we need to decide what confidence level we will choose. Usually, it is considered at 95%. After that, we need to find the corresponding Z value from that table. For 95%, the Z value is 1.96, and it is the most used Z value.
- After that, we simply need to put these values in the said formula, and we will get the confidence interval.
Practice Problem
In a package, there are over a few hundred potatoes. You have to choose 49 random potatoes, where the mean is 100, and the standard deviation is 5.1. Find out whether the potatoes are big enough in size.
⇒ Here, we have mean or X̄ = 100, standard deviation or σ = 5.1, and n = 49.
Since nothing is given, we take 95% as the confidence level. From the confidence interval table, it follows that the Z value is 1.960.
Hence, we have-
Hence, the range of the potatoes is going to be within 98.572 and 101.428, with 1.428 as the margin of error.
Context and Applications
The topic of confidence intervals is a part of estimation under probability and statistical inference. Exams such as CSIR, ISI, CMI, and graduate-level entrance exams in the field of statistics include this topic in their syllabus.
- Bachelor of Science in Mathematics
- Master of Science in Mathematics
Want more help with your statistics homework?
*Response times may vary by subject and question complexity. Median response time is 34 minutes for paid subscribers and may be longer for promotional offers.
Search. Solve. Succeed!
Study smarter access to millions of step-by step textbook solutions, our Q&A library, and AI powered Math Solver. Plus, you get 30 questions to ask an expert each month.
Confidence Intervals Homework Questions from Fellow Students
Browse our recently answered Confidence Intervals homework questions.
Search. Solve. Succeed!
Study smarter access to millions of step-by step textbook solutions, our Q&A library, and AI powered Math Solver. Plus, you get 30 questions to ask an expert each month.