Explain the concept of “central tendency” by constructing histograms of the three data sets represented under columns 1, 2, and 3 as shown in the Table Q5(b) (see attached image). Discuss variation between each histogram
Explain the concept of “central tendency” by constructing histograms of the three data sets represented under columns 1, 2, and 3 as shown in the Table Q5(b) (see attached image). Discuss variation between each histogram

Algebra & Trigonometry with Analytic Geometry
13th Edition
ISBN:9781133382119
Author:Swokowski
Publisher:Swokowski
Chapter9: Systems Of Equations And Inequalities
Section9.3: Systems Of Inequalities
Problem 8E

Related questions
Question
Explain the concept of “
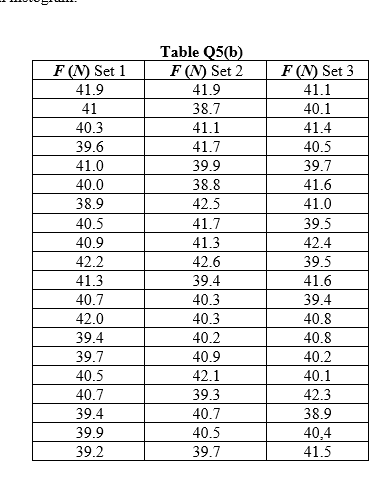
Transcribed Image Text:F (N) Set 1
41.9
41
40.3
39.6
41.0
40.0
38.9
40.5
40.9
42.2
41.3
40.7
42.0
39.4
39.7
40.5
40.7
39.4
39.9
39.2
Table Q5(b)
F (N) Set 2
41.9
38.7
41.1
41.7
39.9
38.8
42.5
41.7
41.3
42.6
39.4
40.3
40.3
40.2
40.9
42.1
39.3
40.7
40.5
39.7
F (N) Set 3
41.1
40.1
41.4
40.5
39.7
41.6
41.0
39.5
42.4
39.5
41.6
39.4
40.8
40.8
40.2
40.1
42.3
38.9
40,4
41.5
Expert Solution
This question has been solved!
Explore an expertly crafted, step-by-step solution for a thorough understanding of key concepts.

Step by step
Solved in 6 steps with 3 images

Recommended textbooks for you
Algebra & Trigonometry with Analytic Geometry
Algebra
ISBN:
9781133382119
Author:
Swokowski
Publisher:
Cengage

Glencoe Algebra 1, Student Edition, 9780079039897…
Algebra
ISBN:
9780079039897
Author:
Carter
Publisher:
McGraw Hill

College Algebra
Algebra
ISBN:
9781305115545
Author:
James Stewart, Lothar Redlin, Saleem Watson
Publisher:
Cengage Learning
Algebra & Trigonometry with Analytic Geometry
Algebra
ISBN:
9781133382119
Author:
Swokowski
Publisher:
Cengage
Glencoe Algebra 1, Student Edition, 9780079039897…
Algebra
ISBN:
9780079039897
Author:
Carter
Publisher:
McGraw Hill
College Algebra
Algebra
ISBN:
9781305115545
Author:
James Stewart, Lothar Redlin, Saleem Watson
Publisher:
Cengage Learning