Explain the MVA table based image

Glencoe Algebra 1, Student Edition, 9780079039897, 0079039898, 2018
18th Edition
ISBN:9780079039897
Author:Carter
Publisher:Carter
Chapter10: Statistics
Section10.5: Comparing Sets Of Data
Problem 2GP

Related questions
Question
1. Explain the MVA table based image.
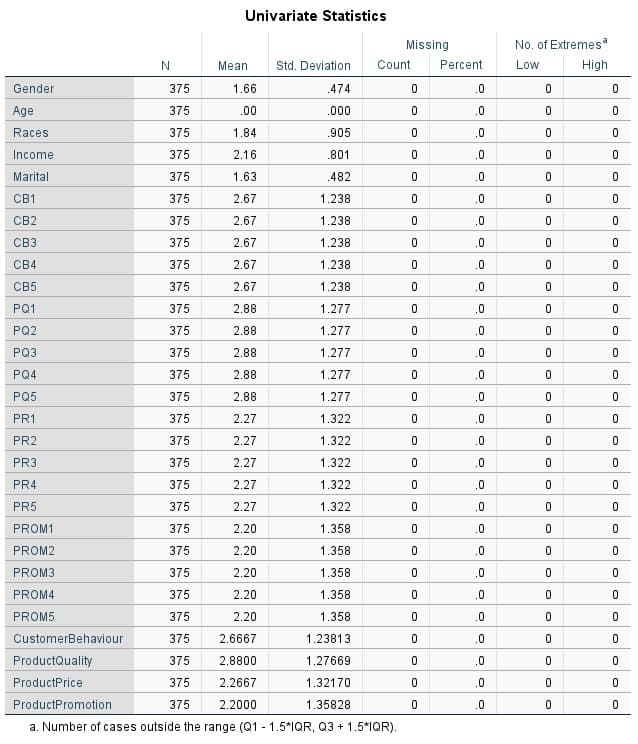
Transcribed Image Text:Gender
Age
Races
Income
Marital
CB1
CB2
CB3
CB4
CB5
PQ1
PQ2
PQ3
PQ4
PQ5
PR1
PR2
PR3
PR4
PR5
PROM1
PROM2
PROM3
PROM4
PROM5
CustomerBehaviour
ProductQuality
ProductPrice
Std. Deviation
1.66
474
.00
.000
1.84
.905
2.16
.801
1.63
.482
2.67
1.238
2.67
1.238
2.67
1.238
2.67
1.238
2.67
1.238
2.88
1.277
2.88
1.277
2.88
1.277
2.88
1.277
2.88
1.277
2.27
1.322
2.27
1.322
375
2.27
1.322
375
2.27
1.322
375
2.27
1.322
375
2.20
1.358
375
2.20
1.358
375
2.20
1.358
375
2.20
1.358
375
2.20
1.358
375 2.6667
1.23813
375 2.8800
1.27669
375 2.2667
1.32170
ProductPromotion
375
2.2000
1.35828
a. Number of cases outside the range (Q1 - 1.5*1QR, Q3 +1.5*IQR).
N
375
375
375
375
375
375
375
375
Univariate Statistics
375
375
375
375
375
375
375
375
375
Mean
Missing
Count
0
0
0
0
0
0
0
0
0
0
0
0
0
0
0
0
0
0
0
0
0
0
0
0
0
0
0
0
0
Percent
.0
.0
.0
.0
.0
.0
.0
.0
.0
.0
.0
.0
.0
.0
.0
.0
.0
.0
.0
.0
.0
.0
.0
.0
.0
.0
.0
.0
.0
No. of Extremesª
Low
High
0
0
0
0
0
0
0
0
0
0
0
0
0
0
0
0
0
0
0
0
0
0
0
0
0
0
0
0
0
0
0
0
0
0
0
0
0
0
0
0
0
0
0
0
0
0
0
0
0
0
0
0
0
0
0
0
0
0
Expert Solution
This question has been solved!
Explore an expertly crafted, step-by-step solution for a thorough understanding of key concepts.

Step by step
Solved in 3 steps

Recommended textbooks for you
Glencoe Algebra 1, Student Edition, 9780079039897…
Algebra
ISBN:
9780079039897
Author:
Carter
Publisher:
McGraw Hill
Glencoe Algebra 1, Student Edition, 9780079039897…
Algebra
ISBN:
9780079039897
Author:
Carter
Publisher:
McGraw Hill