

Explain the relationship between the
Explain what we can understand by expected inflation, inflation due to an increase in aggregate demand or inflation due to a decrease in
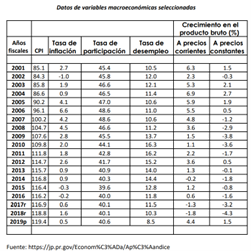
Using the data in the table, integrate the expected relationship of the behavior of inflation with the phases of the economic cycle. You must use the different levels of inflation rate with


Trending now
This is a popular solution!

Step by step
Solved in 3 steps

Use the graph(s) created in the previous question to contrast the effects and consequences of inflation and deflation in the short and long term.
(the question before was:
Using the data in the table, integrate the expected relationship of the behavior of inflation with the phases of the economic cycle. You must use the different levels of inflation rate with

Using the data in the table, integrate the expected relationship of the behavior of inflation with the phases of the economic cycle. You must use the different levels of inflation rate with

Explain what we can understand by expected inflation, inflation due to an increase in aggregate
Using the data in the table, integrate the expected relationship of the behavior of inflation with the phases of the economic cycle. You must use the different levels of inflation rate with


