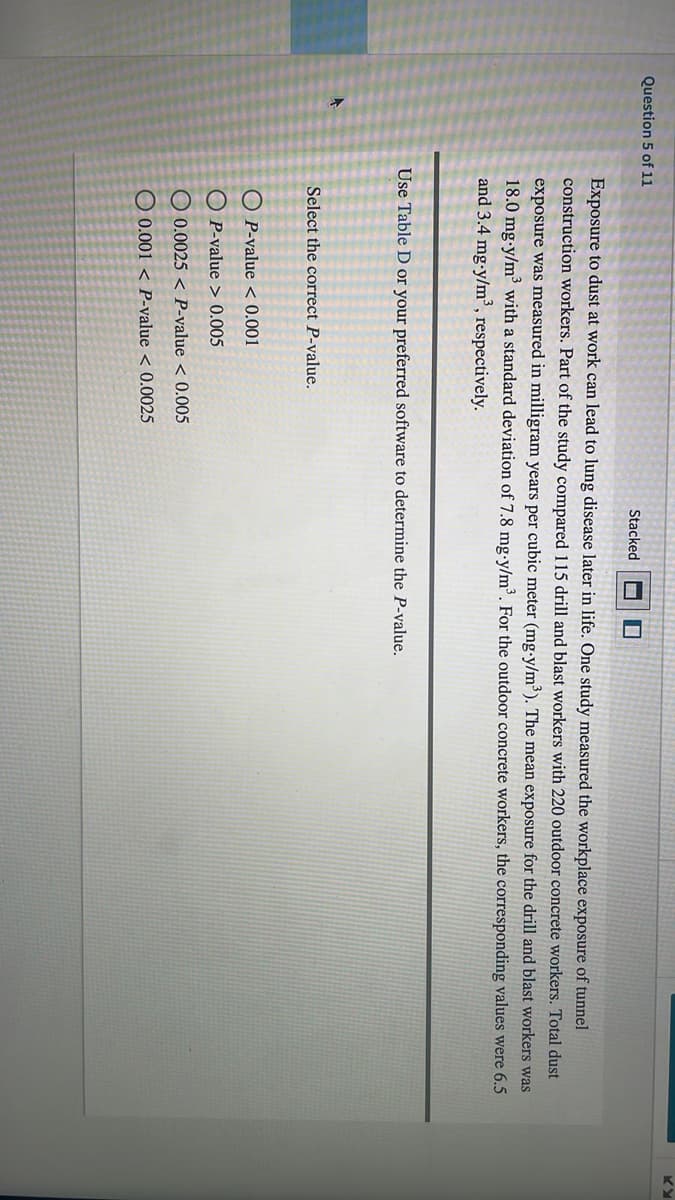
Exposure to dust at work can lead to lung disease later in life. One study measured the workplace exposure of tunnel construction workers. Part of the study compared 115 drill and blast workers with 220 outdoor concrete workers. Total dust exposure was measured in milligram years per cubic meter (mg-y/m³). The mean exposure for the drill and blast workers was 18.0 mg-y/m³ with a standard deviation of 7.8 mg-y/m³. For the outdoor concrete workers, the corresponding values were 6.5 and 3.4 mg-y/m³, respectively. Use Table D or your preferred software to determine the P-value. Select the correct P-value. O P-value < 0.001 O P-value > 0.005 O 0.0025 < P-value < 0.005 O 0.001 < P-value < 0.0025
Exposure to dust at work can lead to lung disease later in life. One study measured the workplace exposure of tunnel construction workers. Part of the study compared 115 drill and blast workers with 220 outdoor concrete workers. Total dust exposure was measured in milligram years per cubic meter (mg-y/m³). The mean exposure for the drill and blast workers was 18.0 mg-y/m³ with a standard deviation of 7.8 mg-y/m³. For the outdoor concrete workers, the corresponding values were 6.5 and 3.4 mg-y/m³, respectively. Use Table D or your preferred software to determine the P-value. Select the correct P-value. O P-value < 0.001 O P-value > 0.005 O 0.0025 < P-value < 0.005 O 0.001 < P-value < 0.0025
Glencoe Algebra 1, Student Edition, 9780079039897, 0079039898, 2018
18th Edition
ISBN:9780079039897
Author:Carter
Publisher:Carter
Chapter10: Statistics
Section10.1: Measures Of Center
Problem 4GP
Related questions
Question

Transcribed Image Text:Question 5 of 11
Stacked
Exposure to dust at work can lead to lung disease later in life. One study measured the workplace exposure of tunnel
construction workers. Part of the study compared 115 drill and blast workers with 220 outdoor concrete workers. Total dust
exposure was measured in milligram years per cubic meter (mg-y/m³). The mean exposure for the drill and blast workers was
18.0 mg y/m³ with a standard deviation of 7.8 mg-y/m³. For the outdoor concrete workers, the corresponding values were 6.5
and 3.4 mg-y/m', respectively.
Use Table D or your preferred software to determine the P-value.
Select the correct P-value.
O P-value < 0.001
O P-value > 0.005
O 0.0025 < P-value < 0.005
O 0.001 < P-value < 0.0025
Expert Solution
This question has been solved!
Explore an expertly crafted, step-by-step solution for a thorough understanding of key concepts.
Step by step
Solved in 2 steps with 1 images

Recommended textbooks for you

Glencoe Algebra 1, Student Edition, 9780079039897…
Algebra
ISBN:
9780079039897
Author:
Carter
Publisher:
McGraw Hill

Glencoe Algebra 1, Student Edition, 9780079039897…
Algebra
ISBN:
9780079039897
Author:
Carter
Publisher:
McGraw Hill