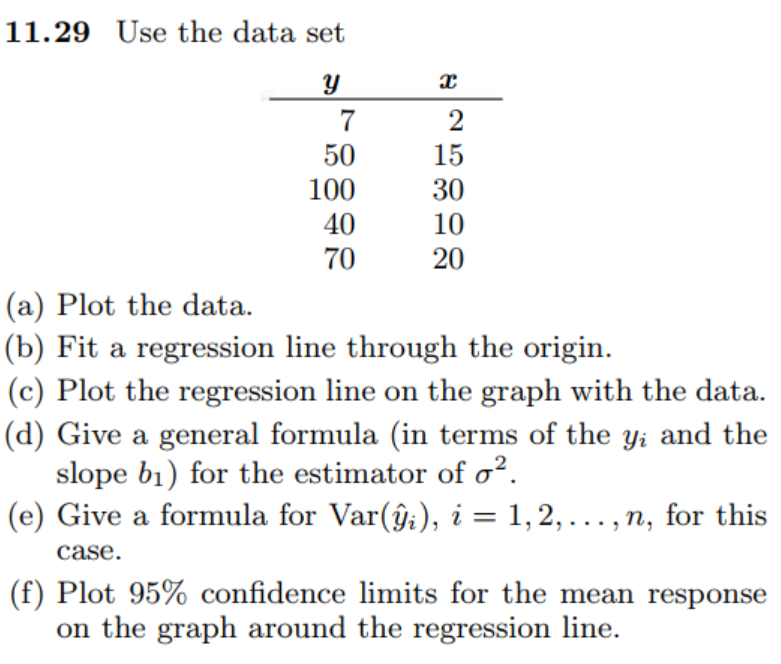
(f) Plot 95% confidence limits for the mean response on the graph around the regression line.


Q: * if the o is not known and (n< 30) can be used z O
A: Which one is the correct choice
Q: Irequency distribution of Banwan Auto Group's proits on venicle sales last month can be seen below. ...
A: Given : Profit (OMR) Frequency 200-600 8 600-1000 11 1000-1400 23 1400-1800 38 1800-220...
Q: Setting a smaller alpha level means: A) No answer text provided. B)The acceptance region becomes s...
A: Given- Setting a smaller alpha level means: A) No answer text provided. B)The acceptance region beco...
Q: A store randomly samples 603 shoppers over the course of a year and finds that 142 of them made thei...
A:
Q: a. The following ANOVA table contains some of the values from the analysis. Assume that the four pop...
A: It is given that Number of groups, k = 4 Number of observations N = 4 × 50 = 200 SS(within) = 74305....
Q: P(-2.8 < z < -1.45)
A: Here normal distribution
Q: The yields of a genetically modified wheat (in bushels per acre) were compared for five different va...
A: As per Bartleby guidelines I can't answer more than three sub parts per post. Please post another s...
Q: Consider the following information given to answer the series of questions below to determine the pr...
A: It is known that, E(X)= ΣXi*P(Xi) E(X2)= ΣXi^2 *P(Xi) Variance= E(X2)-(E(X))2 Standard deviation= sq...
Q: Lightbulbs: The lifetime of lightbulbs has a mean of 1500 hours and a standard deviation of 100 hour...
A:
Q: * 012 = vn1(012+d12)+n2(o22+d22)/n1+n2 is Combined Standard Deviation Coefficient of variation O
A: The formula for two combined group is given and we have to determine what is it calculating.
Q: 1. Hypothesis testing favors sample scores that differ from the mean score by chance alone. 2. Th...
A: (1) Given : Hypothesis testing favors sample scores that differ from the mean score by chance alone...
Q: (c) What is the probability that a random sample of 28 second grade students from the city results i...
A: We have given that. X~N( μ , ?^2 ) μ =92 , ? =10 Z-score =( x - μ )/?
Q: A major textbook publisher has a contract with a printing company. It is known that on average 5% of...
A:
Q: A population has mean u=30 and standard deviation o=5. Find u– and o- for samples of size n=25. Roun...
A: We have given that, Population mean (μ) = 30, population standard deviation (σ) = 5 and sample size...
Q: Find the cumulant generating function of gamma distribution and obtain various cumulants.
A:
Q: For a group of 100 saree weavers of Varanasi, the median and quartile earnings per week are Rs 88.6,...
A:
Q: Suppose you have created a new playlist made up of 6 songs (2 rock, 2 hip-hop, and 2 trance). Find t...
A:
Q: Which of the below is example of a cohort study? A study on Brunel university students to c...
A: In a cohort study, the groups are matched in terms of many other variables such as economic status a...
Q: A regular four-sided die is numbered 1, 2, 3, and 4. Find the probability of each event stated as a ...
A: As per bartelby guideline expert have to answer first three subparts only since I had done all for y...
Q: Suppose IQ scores are approximately normally distributed with a mean of 100 and a standard deviation...
A: Property of normal distribution Mean=median=mode
Q: The mean age of a combined group of men and women is 30 years. If the mean age of the group of men i...
A: Mean : In mathematics, particularly statistics, there are various types of means. The arithmetic mea...
Q: Find Karl Pearson's coefficient of correlation from the following data : Wages Cost of living Wages ...
A:
Q: Use the following Box-and-Whisker Plot to answer Questions 21 and 22. 6th Grade Math Test + + 60 65 ...
A: Box plot is given Box plot shows Minimum and maximum, Q1, Q3, median We have to answer for mention...
Q: what would the f max be? here are the values M1=8.81 S1^2 =67.62 N=20 M2= 8.79 S^2=69.60 N=20
A: We have given that M1=8.81 S1^2 =67.62 N=20 M2= 8.79 S^2=69.60 N=20
Q: How many percent of students have a shoe size between 5" to 6.5"? % (Input the NUMBER ONLY, no other...
A:
Q: You have a sample of 500 individuals arranged in a 2 x 2 table. Of these, 220 have hypertension and ...
A:
Q: 12. Given the following information. Material Required Unit Quantity Required Price (Rs.) 2000 2002 ...
A:
Q: Question 7 We cannot run Augmented Dickey-Fuller tests if there is a deterministic trend. True False
A: ADF test is a common stastical test used to test whether a given Time series is stationary or not.
Q: In a certain city, the average 20- to 29-year old man is 69.8 inches tall, with a standard deviation...
A:
Q: Determine whether the statement is true or false. If it is false, rewrite it as a true statement. ...
A: Given,The point estimate for the population proportion of failures is 1−p.
Q: Does the amount of exercise relate to hours of sleep? Is there a strong, moderate, or weak correlati...
A: We have to calculate correlation coefficient to know strength of relationship. Here, according to gu...
Q: A bag contains 25 balls marked 1 to 25. What is the probability that it is marked One bau is arawn a...
A:
Q: Little Peten'ka refuses to eat broken spaghetti, so his monm wants so compare two brands "M" and "A"...
A: Given that, Little Peten 'ka refuses to eat broken spaghetti, so his mom wants so compare two brands...
Q: Exercise 1: Tell whether the given value is a statistic or a parameter. 1. The city of Manila is pol...
A: In statistics, the population consists the entire set of entities which are under study, whereas, a ...
Q: Question 4 There are hundreds of apples on the trees, so you randomly choose just 79 apples and get ...
A:
Q: Consider the first sample to be the sample of occupants not wearing seat belts and the second sample...
A: To conclude the claim of indifference between the "proportion of occupants killed wearing the seat b...
Q: Question 1: The Gulf Trading Company plans to purchase an embroidery machine for their sewing unit. ...
A: INTRODUCTION: Variance: Variance is the statistical tool used for checking the variability of the d...
Q: (iii) Calculate the probability that more than 10 seconds pass without anybody clicking on the adver...
A: A random variable X is said to follow Poisson distribution, if it has the pmf of the form, P(X=x)=e-...
Q: Calculate the coefficient of correlation for the ages of husband and wife : Age of husband : Age of ...
A:
Q: For a certain frequency table which is partly réproduced here, the mean was found to be 1'46. No, of...
A:
Q: * If HO: u=30 HA: µ #30 O HA: μ 30 Ο all above O dont of them O
A: Given Null hypothesis Ho: μ=30
Q: A hypothesis testing: Ho : p=0.46 HA : p >0.46. We conduct a survey with sample size n =48 and have ...
A:
Q: Suppose IQ scores are approximately normally distributed with a mean of 100 and a standard deviation...
A: We have given that. X~N( μ , ?^2 ) μ =100v, ? =15 Z-score =( x - μ )/?
Q: Below are given weighted index numbers of cost of living of labourers in an industrial centre in Ind...
A:
Q: The mean weight of 150 students in a class is 60 kg. The mean weight of boys in the class is 70 kg. ...
A:
Q: A new railroad is proposed to be built between Canada and the USA. A survey of the opinions about th...
A:
Q: A refrigerator manufacturer claims that the mean life of its competitor's refrigerators is less ...
A:
Q: Based on the regression results, answer the following questions** Data are collected on the income (...
A: (e) The objective is to check if any of the explanatory (independent) variables significant at the 1...
Q: Wu's job pays $13/hour, and requires him to be at work at least 39 hours/week. He is allowed to work...
A:
Q: A company′s old antacid formula provided relief for 70% of the people who used it. The company tests...
A:
Solve Part F. Please and Thank You.


Trending now
This is a popular solution!

Step by step
Solved in 2 steps with 5 images

- The following fictitious table shows kryptonite price, in dollar per gram, t years after 2006. t= Years since 2006 0 1 2 3 4 5 6 7 8 9 10 K= Price 56 51 50 55 58 52 45 43 44 48 51 Make a quartic model of these data. Round the regression parameters to two decimal places.Consider a linear regression model for the decrease in blood pressure (mmHg) over a four-week period with muy=2.8+0.8x and standard deviation chi=3.2. The explanatory variable x is the number of servings fruits and vegetables in a calorie-controlled diet. Using the 68-95-99.7 rule, between what two values would approximately 95% of the observed responses, y, fall when x = 7?A regression on the original regressors, ?̂t2 and a constant term yields the following statistics: R2 = 0.296041 F = 1.177507 coeff of ?̂t2 has a t-statistic of 2.876 With this information, which test can you implement to deal with the problem omitted variables and why? Implement the test as stated in b(i) and interpret the results. What is (are) the consequence(s) of the problem alluded to above on the estimators?
- Consider the following regression equation specied for 2-period panel data: where i = 1; 2; :::N and t = 1; 2. If you expect that β_1 is positive, but the correlation between Δx_i and Δu_i is negative, thenwhat is the bias in the OLS estimator of β_1 in the first-differenced equation?Use the following linear regression equation to answer the questions. (d) x1 = 1.0 + 3.9x2 – 8.4x3 + 2.4x4 Suppose x3 and x4 were held at fixed but arbitrary values and x2 increased by 1 unit. What would be the corresponding change in x1?Suppose x2 increased by 2 units. What would be the expected change in x1?Suppose x2 decreased by 4 units. What would be the expected change in x1?(e) Suppose that n = 8 data points were used to construct the given regression equation and that the standard error for the coefficient of x2 is 0.468. Construct a 90% confidence interval for the coefficient of x2. (Use 2 decimal places.) lower limit upper limit (f) Using the information of part (e) and level of significance 5%, test the claim that the coefficient of x2 is different from zero. (Use 2 decimal places.) t t critical ±Which of the following expressions is the correct way to express an interpretation for an OLS regression coefficient of -0.9? - This question is based on Data Analysis A. For every one unit increase in X there is - on average - a 0.9 unit decrease in Y. B. For every one unit increase in Y there is - on average - a 0.9 unit decrease in X. C. For every one unit increase in Y there is - on average - a 0.9 unit increase in X. D. For every one unit increase in X there is - on average - a 0.9 unit increase in Y.
- In a regression analysis involving 30 observations, the following estimated regression equation was obtained. ŷ = 16.7 + 3.5x1 − 2.3x2 + 7.9x3 + 2.9x4 (a)Interpret b1 in this estimated regression equation. -b1 = 7.9 is an estimate of the change in y corresponding to a 1 unit change in x3 when x1, x2, and x4 are held constant. -b1 = 2.9 is an estimate of the change in y corresponding to a 1 unit change in x4 when x1, x2, and x3 are held constant. -b1 = 3.5 is an estimate of the change in y corresponding to a 1 unit change in x1 when x2, x3, and x4 are held constant. -b1 = 3.5 is an estimate of the change in y corresponding to a 1 unit change in x2 when x1, x3, and x4 are held constant. -b1 = −2.3 is an estimate of the change in y corresponding to a 1 unit change in x1 when x2, x3, and x4 are held constant.Interpret b2 in this estimated regression equation. -b2 = −2.3 is an estimate of the change in y corresponding to a 1 unit change in x1 when x2, x3, and x4 are held…X” denote the number of children ever born to a woman, and let “Y” denote years ofeducation for the woman. A simple model relating fertility to years of education is X = β0 + β1Y + u where u is the unobserved error. (i) What kind of factors are contained in u? Are these likely to be correlated with level of education?The following estimated regression equation based on 10 observations was presented. ŷ = 29.1260 + 0.5306x1 + 0.4680x2 The values of SST and SSR are 6,728.125 and 6,215.375, respectively. (a) Find SSE. SSE = (b) Compute R2. (Round your answer to three decimal places.) R2 = (c) Compute Ra2. (Round your answer to three decimal places.) Ra2 = (d) Comment on the goodness of fit. (For purposes of this exercise, consider a proportion large if it is at least 0.55.) The estimated regression equation provided a good fit as a small proportion of the variability in y has been explained by the estimated regression equation.The estimated regression equation did not provide a good fit as a small proportion of the variability in y has been explained by the estimated regression equation. The estimated regression equation provided a good fit as a large proportion of the variability in y has been explained by the estimated regression equation.
- Consider the following four quantities for a regression coefficient: the estimate of the coefficient, the standard error of the coefficient, the t-value of the coefficient, and the p-value of the coefficient. Which of the following is true? a. If the standard error increases and the estimate itself doesn't change, the magnitude of the t-value will decrease and the p-value will decrease. b. If the standard error decreases and the estimate itself doesn't change, the magnitude of the t-value will increase and the p-value will decrease. c. If the standard error decreases and the estimate itself doesn't change, the magnitude of the t-value will increase and the p-value will increase. d. If the standard error increases and the estimate itself doesn't change, the magnitude of the t-value will increase and the p-value will decrease.1) Find the regression equation and r value Drop Height, y (m) Square of Mean Fall time, t^2 (s^2) 0.100 0.0188 0.300 0.0576 0.500 0.0980 1.000 0.198 1.500 0.305 2.500 0.508A scientist is interested in whether there is a linear relationship between the amount of mercury in a lake and the surface area of the lake. The scientist collected data on 22 lakes of a similar type selected at random and used the data to test the claim that there is a linear relationship. The following hypotheses were used to test the claim. H0:β=0 Ha:β≠0 The test yielded a t-value of 2.086 with a corresponding p-value of 0.05. Which of the following is the correct interpretation of the p-value? A. If there is a linear relationship between the amount of mercury in a lake and the surface area of the lake, the probability of observing a test statistic as extreme as 2.086 or more extreme is 0.05 B. If there is a linear relationship between the amount of mercury in a lake and the surface area of the lake, the probability of observing a test statistic of 2.086 is 0.05. C. If there is not a linear relationship between the amount of mercury in a lake and the surface area of the lake, the…

