(failure) Click the icon to view the Chi-square distribution table. (a) Why is this a dependent sample? A. The same person answered both questions. O B. More than 5% of the population was surveyed. O C. The answer to the second question depends on the answer to the first question. O D. Two questions were asked. (b) Is there a significant difference in the proportion of individuals who smoke and the proportion of individuals that do not wear a seat belt? In other words, is there a significant difference between the proportion of individuals who engage in hazardous activities? Use the a = 0.05 level of significance. Let p, represent the proportion of individuals who smoke and p2 represent the proportion of individuals that do not wear a seat belt. What are the hypotheses for this test? VA. Họ: P1 "P2 O B. Ho: P1
(failure) Click the icon to view the Chi-square distribution table. (a) Why is this a dependent sample? A. The same person answered both questions. O B. More than 5% of the population was surveyed. O C. The answer to the second question depends on the answer to the first question. O D. Two questions were asked. (b) Is there a significant difference in the proportion of individuals who smoke and the proportion of individuals that do not wear a seat belt? In other words, is there a significant difference between the proportion of individuals who engage in hazardous activities? Use the a = 0.05 level of significance. Let p, represent the proportion of individuals who smoke and p2 represent the proportion of individuals that do not wear a seat belt. What are the hypotheses for this test? VA. Họ: P1 "P2 O B. Ho: P1

Holt Mcdougal Larson Pre-algebra: Student Edition 2012
1st Edition
ISBN:9780547587776
Author:HOLT MCDOUGAL
Publisher:HOLT MCDOUGAL
Chapter11: Data Analysis And Probability
Section: Chapter Questions
Problem 8CR

Related questions
Topic Video
Question
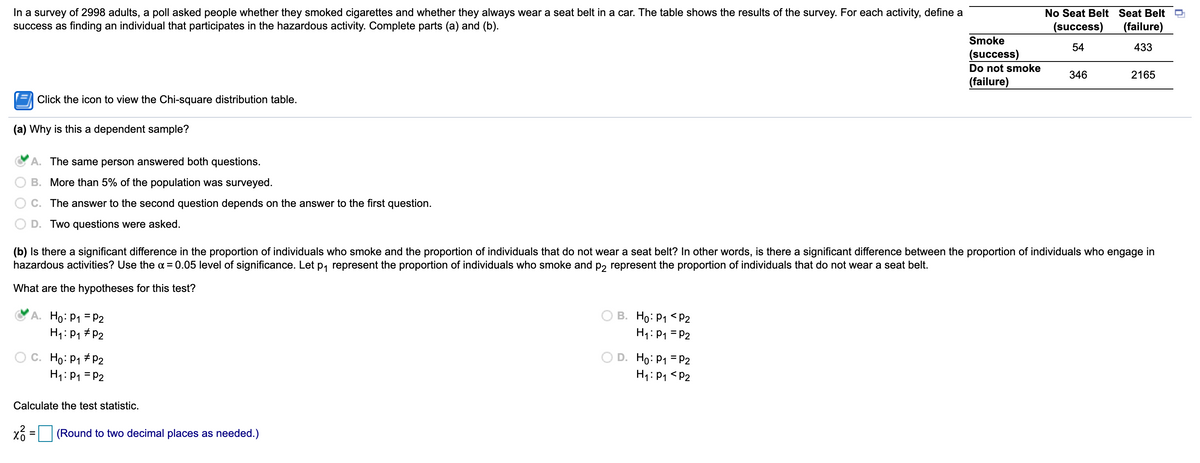
Transcribed Image Text:In a survey of 2998 adults, a poll asked people whether they smoked cigarettes and whether they always wear a seat belt in a car. The table shows the results of the survey. For each activity, define a
success as finding an individual that participates in the hazardous activity. Complete parts (a) and (b).
No Seat Belt Seat Belt
(success)
(failure)
Smoke
54
433
(success)
Do not smoke
346
2165
(failure)
Click the icon to view the Chi-square distribution table.
(a) Why is this a dependent sample?
A. The same person answered both questions.
B. More than 5% of the population was surveyed.
C. The answer to the second question depends on the answer to the first question.
D. Two questions were asked.
(b) Is there a significant difference in the proportion of individuals who smoke and the proportion of individuals that do not wear a seat belt? In other words, is there a significant difference between the proportion of individuals who engage in
hazardous activities? Use the a = 0.05 level of significance. Let p, represent the proportion of individuals who smoke and p, represent the proportion of individuals that do not wear a seat belt.
What are the hypotheses for this test?
A. Ho: P1 = P2
H1: P1 #P2
В. Но: Р1 <Р2
H1: P1 = P2
C. Ho: P1 # P2
H1:P1 = P2
O D. Ho: P1 = P2
H1: P1 <P2
Calculate the test statistic.
(Round to two decimal places as needed.)
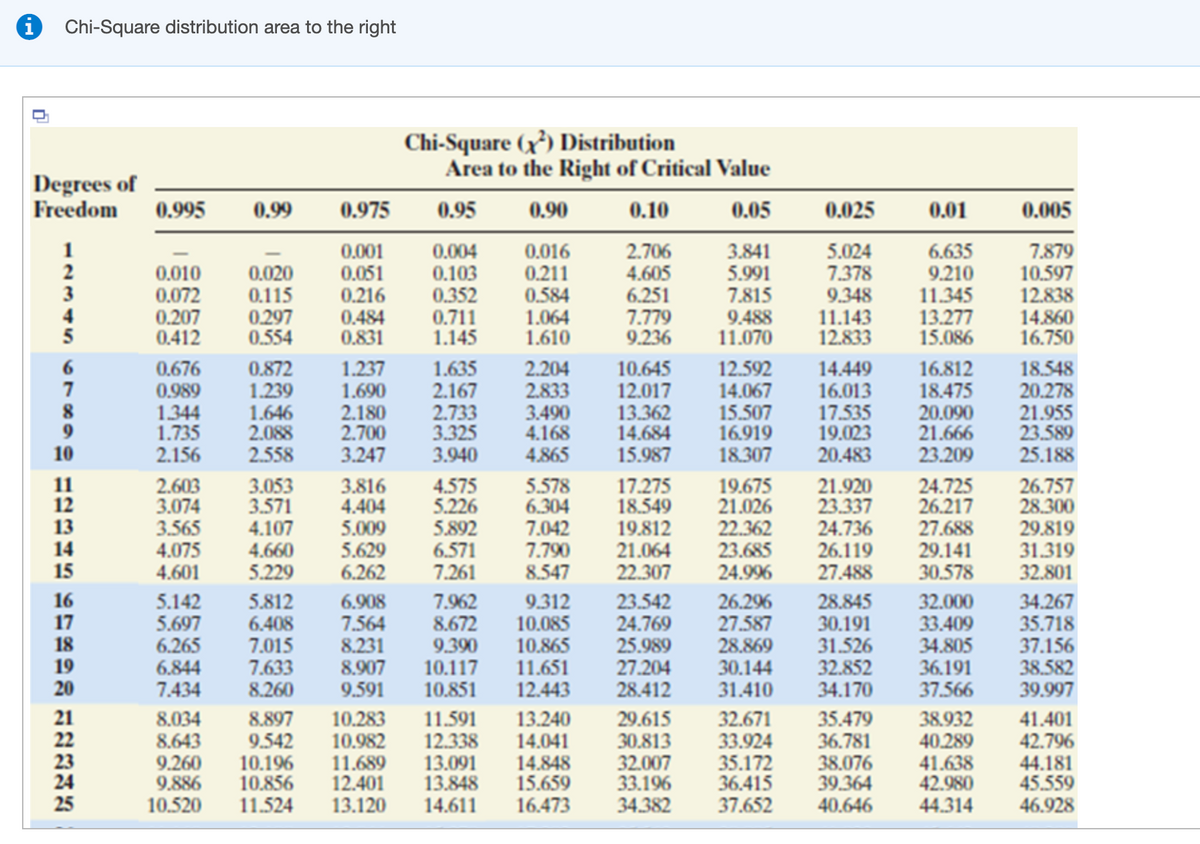
Transcribed Image Text:Chi-Square distribution area to the right
Chi-Square (x³) Distribution
Area to the Right of Critical Value
Degrees of
Freedom
0.995
0.99
0.975
0.95
0.90
0.10
0.05
0.025
0.01
0.005
1
2
3
0.020
0.115
0.297
0.554
0.001
0.051
0.216
0.484
0.831
0.004
0.103
0.352
0.016
0.211
0.584
1.064
1.610
2.706
4.605
6.251
7.779
9.236
3.841
5.991
7.815
5.024
7.378
9.348
11.143
12.833
6.635
9.210
11.345
7.879
10.597
12.838
0.010
0.072
0.207
0.412
0.711
1.145
9.488
11.070
13.277
15.086
14.860
16.750
5
12.592
14.067
15.507
16.919
18.307
18.548
20.278
21.955
23.589
25.188
6
7
0.676
0.989
1.344
1.735
2.156
0.872
1.239
1.646
2.088
2.558
1.237
1.690
2.180
2.700
3.247
1.635
2.167
2.733
3.325
3.940
2.204
2.833
3.490
4.168
4.865
10.645
12.017
13.362
14.684
15.987
14.449
16.013
17.535
19.023
20.483
16.812
18.475
20.090
21.666
23.209
10
11
12
13
14
15
2.603
3.074
3.565
4.075
4.601
3.053
3.571
4.107
4.660
5.229
3.816
4.404
5.009
5.629
6.262
4.575
5.226
5.892
6.571
7.261
5.578
6.304
7.042
7.790
8.547
17.275
18.549
19.812
21.064
22.307
19.675
21.026
22.362
23.685
24.996
21.920
23.337
24.736
26.119
27.488
24.725
26.217
27.688
29.141
30.578
26.757
28.300
29.819
31.319
32.801
16
17
18
19
20
5.142
5.697
6.265
6.844
7.434
5.812
6.408
7.015
7.633
8.260
6.908
7.564
8.231
8.907
9.591
7.962
8.672
9.390
10.117
10.851
9.312
10.085
10.865
11.651
12.443
23.542
24.769
25.989
27.204
28.412
26.296
27.587
28.869
30.144
31.410
28.845
30.191
31.526
32.852
34.170
32.000
33.409
34.805
36.191
37.566
34.267
35.718
37.156
38.582
39.997
21
22
23
24
25
8.034
8.643
9.260
9.886
10.520
8.897
9.542
10.196
10.856
11.524
10.283
10.982
11.689
12.401
13.120
11.591
12.338
13.091
13.848
14.611
13.240
14.041
14.848
15.659
16.473
29.615
30.813
32.007
33.196
34.382
32.671
33.924
35.172
36.415
37.652
35.479
36.781
38.076
39.364
40.646
38.932
40.289
41.638
42.980
44.314
41.401
42.796
44.181
45.559
46.928
Expert Solution
This question has been solved!
Explore an expertly crafted, step-by-step solution for a thorough understanding of key concepts.

Step by step
Solved in 5 steps with 2 images

Knowledge Booster


Learn more about
Need a deep-dive on the concept behind this application? Look no further. Learn more about this topic, statistics and related others by exploring similar questions and additional content below.Recommended textbooks for you
Holt Mcdougal Larson Pre-algebra: Student Edition…
Algebra
ISBN:
9780547587776
Author:
HOLT MCDOUGAL
Publisher:
HOLT MCDOUGAL

Algebra & Trigonometry with Analytic Geometry
Algebra
ISBN:
9781133382119
Author:
Swokowski
Publisher:
Cengage
Holt Mcdougal Larson Pre-algebra: Student Edition…
Algebra
ISBN:
9780547587776
Author:
HOLT MCDOUGAL
Publisher:
HOLT MCDOUGAL
Algebra & Trigonometry with Analytic Geometry
Algebra
ISBN:
9781133382119
Author:
Swokowski
Publisher:
Cengage