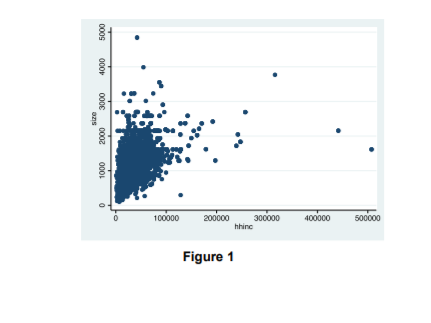
Figure 1 reports a scatter plot of hhinc (horizontal axis) and size (vertical axis). Do you see any correlation in the data? Can you conclude that a higher net income causes a higher home size?
Figure 1 reports a scatter plot of hhinc (horizontal axis) and size (vertical axis). Do you see any correlation in the data? Can you conclude that a higher net income causes a higher home size?

Glencoe Algebra 1, Student Edition, 9780079039897, 0079039898, 2018
18th Edition
ISBN:9780079039897
Author:Carter
Publisher:Carter
Chapter10: Statistics
Section10.6: Summarizing Categorical Data
Problem 23PPS

Related questions
Question
Figure 1 reports a
you see any
causes a higher home size?
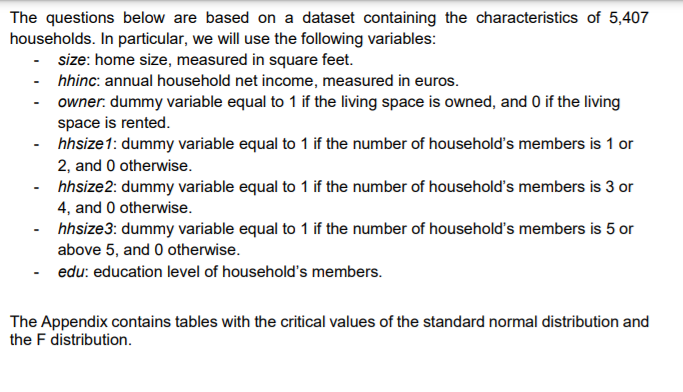
Transcribed Image Text:The questions below are based on a dataset containing the characteristics of 5,407
households. In particular, we will use the following variables:
- size: home size, measured in square feet.
- hhinc: annual household net income, measured in euros.
- owner. dummy variable equal to 1 if the living space is owned, and 0 if the living
space is rented.
- hhsize1: dummy variable equal to 1 if the number of household's members is 1 or
2, and 0 otherwise.
hhsize2: dummy variable equal to 1 if the number of household's members is 3 or
4, and 0 otherwise.
hhsize3: dummy variable equal to 1 if the number of household's members is 5 or
above 5, and 0 otherwise.
- edu: education level of household's members.
The Appendix contains tables with the critical values of the standard normal distribution and
the F distribution.
Transcribed Image Text:100000
200000
400000
300000
hhine
500000
Figure 1
000s
000
000€
0002
000L
Expert Solution
This question has been solved!
Explore an expertly crafted, step-by-step solution for a thorough understanding of key concepts.

Step by step
Solved in 2 steps with 1 images

Recommended textbooks for you
Glencoe Algebra 1, Student Edition, 9780079039897…
Algebra
ISBN:
9780079039897
Author:
Carter
Publisher:
McGraw Hill

Big Ideas Math A Bridge To Success Algebra 1: Stu…
Algebra
ISBN:
9781680331141
Author:
HOUGHTON MIFFLIN HARCOURT
Publisher:
Houghton Mifflin Harcourt

Holt Mcdougal Larson Pre-algebra: Student Edition…
Algebra
ISBN:
9780547587776
Author:
HOLT MCDOUGAL
Publisher:
HOLT MCDOUGAL
Glencoe Algebra 1, Student Edition, 9780079039897…
Algebra
ISBN:
9780079039897
Author:
Carter
Publisher:
McGraw Hill
Big Ideas Math A Bridge To Success Algebra 1: Stu…
Algebra
ISBN:
9781680331141
Author:
HOUGHTON MIFFLIN HARCOURT
Publisher:
Houghton Mifflin Harcourt
Holt Mcdougal Larson Pre-algebra: Student Edition…
Algebra
ISBN:
9780547587776
Author:
HOLT MCDOUGAL
Publisher:
HOLT MCDOUGAL