Figure 2 shows the results of the Tukey test to test pairwise differences at the significance level 0.05 for the additive model using design and region with regards to their impact on the survey responses. Figure 2. Tukey test results showing pairwise factor level comparison with regards to impact on the survey responses. P adj shows the p value for each pairwise level comparison. P values with 0.0000000 indicate that the p value is < 0.00000001. Tukey multiple comparisons of means 95% family-wise confidence level Fit: aov(formula - Response - Design + Region, data - ads) SDesign diff. 1wr upr p adj 2-1 167.916667 3-1 3-2 -175. 583333 -213.46216 -137.70451 0.0000000 130.03784 205.79549 0.0000000 -45. 54549 -7.666667 30. 21216 0. 8723492 SRegion p adj diff 76.000000 -49.000000 1wr upr 27.75772 124.2422836 0.0009529 NW-NE SE-NE -97.24228 -0.7577164 0.0454415 1047
Figure 2 shows the results of the Tukey test to test pairwise differences at the significance level 0.05 for the additive model using design and region with regards to their impact on the survey responses. Figure 2. Tukey test results showing pairwise factor level comparison with regards to impact on the survey responses. P adj shows the p value for each pairwise level comparison. P values with 0.0000000 indicate that the p value is < 0.00000001. Tukey multiple comparisons of means 95% family-wise confidence level Fit: aov(formula - Response - Design + Region, data - ads) SDesign diff. 1wr upr p adj 2-1 167.916667 3-1 3-2 -175. 583333 -213.46216 -137.70451 0.0000000 130.03784 205.79549 0.0000000 -45. 54549 -7.666667 30. 21216 0. 8723492 SRegion p adj diff 76.000000 -49.000000 1wr upr 27.75772 124.2422836 0.0009529 NW-NE SE-NE -97.24228 -0.7577164 0.0454415 1047

Linear Algebra: A Modern Introduction
4th Edition
ISBN:9781285463247
Author:David Poole
Publisher:David Poole
Chapter7: Distance And Approximation
Section7.3: Least Squares Approximation
Problem 31EQ

Related questions
Question
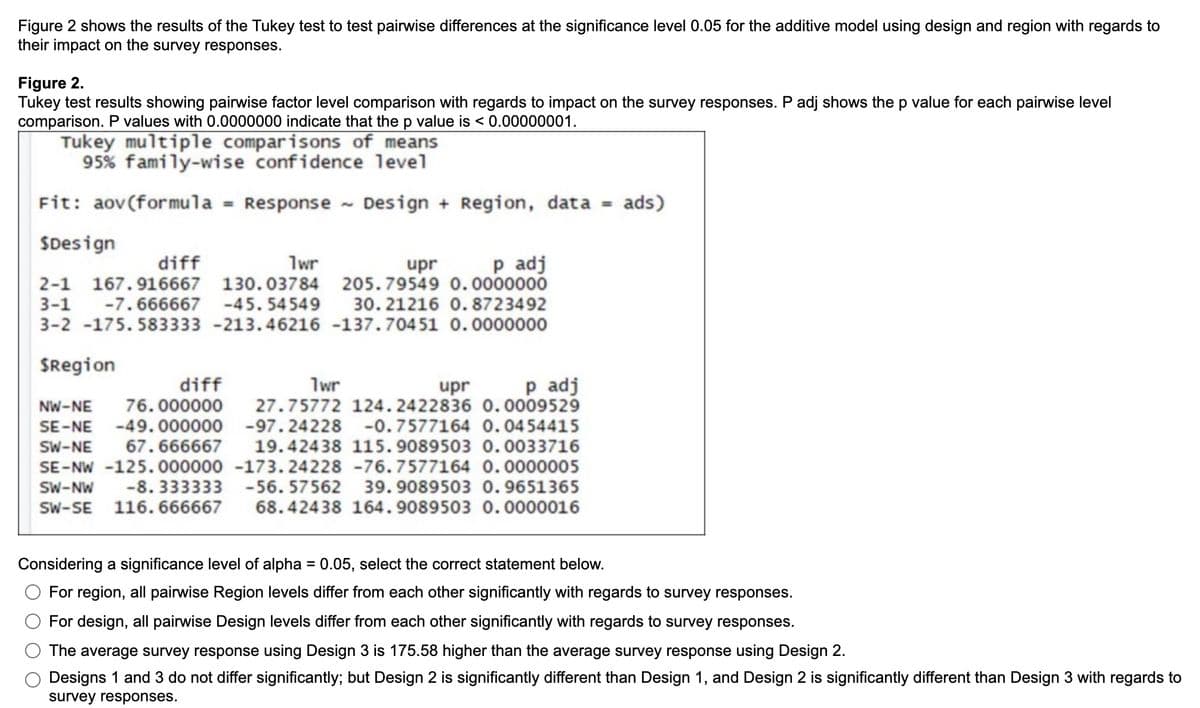
Transcribed Image Text:Figure 2 shows the results of the Tukey test to test pairwise differences at the significance level 0.05 for the additive model using design and region with regards to
their impact on the survey responses.
Figure 2.
Tukey test results showing pairwise factor level comparison with regards to impact on the survey responses. P adj shows the p value for each pairwise level
comparison. P values with 0.0000000 indicate that the p value is < 0.00000001.
Tukey multiple comparisons of means
95% family-wise confidence level
Fit: aov(formula = Response ~ Design + Region, data = ads)
SDesign
p adj
2-1 167.916667 130. 03784 205.79549 0.0000000
30. 21216 0. 8723492
3-2 -175. 583333 -213.46216 -137.70451 0.0000000
diff
1wr
upr
3-1
-7.666667 -45. 54549
SRegion
p adj
27.75772 124.2422836 0.0009529
SE-NE -49. 000000 -97.24228 -0.7577164 0.0454415
19.42438 115. 9089503 0.0033716
SE-NW -125.000000 -173.24228 -76.7577164 0.0000005
-8. 333333 -56. 57562 39.9089503 0.9651365
68.42438 164.9089503 0.0000016
diff
76.000000
1wr
upr
NW-NE
SW-NE
67.666667
SW-NW
SW-SE 116. 666667
Considering a significance level of alpha = 0.05, select the correct statement below.
%3D
For region, all pairwise Region levels differ from each other significantly with regards to survey responses.
For design, all pairwise Design levels differ from each other significantly with regards to survey responses.
The average survey response using Design 3 is 175.58 higher than the average survey response using Design 2.
Designs 1 and 3 do not differ significantly; but Design 2 is significantly different than Design 1, and Design 2 is significantly different than Design 3 with regards to
survey responses.
Expert Solution
This question has been solved!
Explore an expertly crafted, step-by-step solution for a thorough understanding of key concepts.

This is a popular solution!

Trending now
This is a popular solution!

Step by step
Solved in 2 steps with 2 images

Recommended textbooks for you
Linear Algebra: A Modern Introduction
Algebra
ISBN:
9781285463247
Author:
David Poole
Publisher:
Cengage Learning
Linear Algebra: A Modern Introduction
Algebra
ISBN:
9781285463247
Author:
David Poole
Publisher:
Cengage Learning