Figure 2.23 Profit as a Function of Order Quantity and Demand 21 Data table of profit as a function of order quantity (along side) and demand (along top) 50 1500 $3,000 $7,000 $10,500 2500 $3,000 $7,000 $9,375 500 1000 $3,000 $7,000 $500 -$4,500 -$20,625 -$10,625 -$25,250 -$15,250 -$31,125 -$21,125 -$11,125 -$35,200 -$25,200 -$15,200 -$40,850 -$30,850 -$20,850 -$10,850 2000 3000 $3,000 $7,000 $10,500 $10,500 $15,500 $19,375 $24,750 $18,875 $4,800 $14,800 $9,150 22 3500 4000 4500 $3,000 $7,000 $10,500 $5,500 $15,500 $15,500 $9,375 $19,375 $4,750 $1,125 -$5,200 $3,000 $7,000 $10,500 $15,500 $19,375 $3,000 $7,000 $10,500 $15,500 $19,375 $24,750 $28,875 $34,800 $39,150 $3,000 -$3,000 -$9,500 -$14,500 $3,000 $7,000 $10,500 $15,500 $19,375 23 24 1000 25 1500 26 2000 27 2500 -$625 3000 -$5,250 $14,750 $24,750 $28,875 $24,800 $19,150 $24,750 $28,875 $34,800 $29,150 28 3500 4000 4500 29 $8,875 30 31 -$850
Figure 2.23 Profit as a Function of Order Quantity and Demand 21 Data table of profit as a function of order quantity (along side) and demand (along top) 50 1500 $3,000 $7,000 $10,500 2500 $3,000 $7,000 $9,375 500 1000 $3,000 $7,000 $500 -$4,500 -$20,625 -$10,625 -$25,250 -$15,250 -$31,125 -$21,125 -$11,125 -$35,200 -$25,200 -$15,200 -$40,850 -$30,850 -$20,850 -$10,850 2000 3000 $3,000 $7,000 $10,500 $10,500 $15,500 $19,375 $24,750 $18,875 $4,800 $14,800 $9,150 22 3500 4000 4500 $3,000 $7,000 $10,500 $5,500 $15,500 $15,500 $9,375 $19,375 $4,750 $1,125 -$5,200 $3,000 $7,000 $10,500 $15,500 $19,375 $3,000 $7,000 $10,500 $15,500 $19,375 $24,750 $28,875 $34,800 $39,150 $3,000 -$3,000 -$9,500 -$14,500 $3,000 $7,000 $10,500 $15,500 $19,375 23 24 1000 25 1500 26 2000 27 2500 -$625 3000 -$5,250 $14,750 $24,750 $28,875 $24,800 $19,150 $24,750 $28,875 $34,800 $29,150 28 3500 4000 4500 29 $8,875 30 31 -$850

Operations Research : Applications and Algorithms
4th Edition
ISBN:9780534380588
Author:Wayne L. Winston
Publisher:Wayne L. Winston
Chapter24: Forecasting Models
Section24.8: Multiple Regression
Problem 4P

Related questions

Question
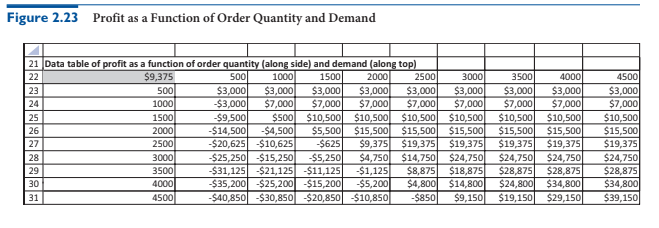
The spreadsheet model for Sam’s Bookstore contains a two-way data table for profit versus order quantity and demand. Experiment with Excel’s chart types to create a chart that shows this information graphically in an
intuitive format. (Choose the format you would choose to give a presentation to your boss.)
Transcribed Image Text:Figure 2.23 Profit as a Function of Order Quantity and Demand
21 Data table of profit as a function of order quantity (along side) and demand (along top)
50
1500
$3,000
$7,000
$10,500
2500
$3,000
$7,000
$9,375
500
1000
$3,000
$7,000
$500
-$4,500
-$20,625 -$10,625
-$25,250 -$15,250
-$31,125 -$21,125 -$11,125
-$35,200 -$25,200 -$15,200
-$40,850 -$30,850 -$20,850 -$10,850
2000
3000
$3,000
$7,000
$10,500 $10,500
$15,500
$19,375
$24,750
$18,875
$4,800 $14,800
$9,150
22
3500
4000
4500
$3,000
$7,000
$10,500
$5,500 $15,500 $15,500
$9,375 $19,375
$4,750
$1,125
-$5,200
$3,000
$7,000
$10,500
$15,500
$19,375
$3,000
$7,000
$10,500
$15,500
$19,375
$24,750
$28,875
$34,800
$39,150
$3,000
-$3,000
-$9,500
-$14,500
$3,000
$7,000
$10,500
$15,500
$19,375
23
24
1000
25
1500
26
2000
27
2500
-$625
3000
-$5,250
$14,750
$24,750
$28,875
$24,800
$19,150
$24,750
$28,875
$34,800
$29,150
28
3500
4000
4500
29
$8,875
30
31
-$850
Expert Solution
This question has been solved!
Explore an expertly crafted, step-by-step solution for a thorough understanding of key concepts.

This is a popular solution!

Trending now
This is a popular solution!

Step by step
Solved in 2 steps with 2 images

Knowledge Booster


Learn more about
Need a deep-dive on the concept behind this application? Look no further. Learn more about this topic, computer-science and related others by exploring similar questions and additional content below.Recommended textbooks for you
Operations Research : Applications and Algorithms
Computer Science
ISBN:
9780534380588
Author:
Wayne L. Winston
Publisher:
Brooks Cole

Np Ms Office 365/Excel 2016 I Ntermed
Computer Science
ISBN:
9781337508841
Author:
Carey
Publisher:
Cengage
Operations Research : Applications and Algorithms
Computer Science
ISBN:
9780534380588
Author:
Wayne L. Winston
Publisher:
Brooks Cole
Np Ms Office 365/Excel 2016 I Ntermed
Computer Science
ISBN:
9781337508841
Author:
Carey
Publisher:
Cengage