Figure 3: sample size = 10000 0.9 0.8 lacf Opacf 0.7 0.6 0.5 0.4 0.3 acf and pact

Chapter1: Taking Risks And Making Profits Within The Dynamic Business Environment
Section: Chapter Questions
Problem 1CE

Related questions

Question
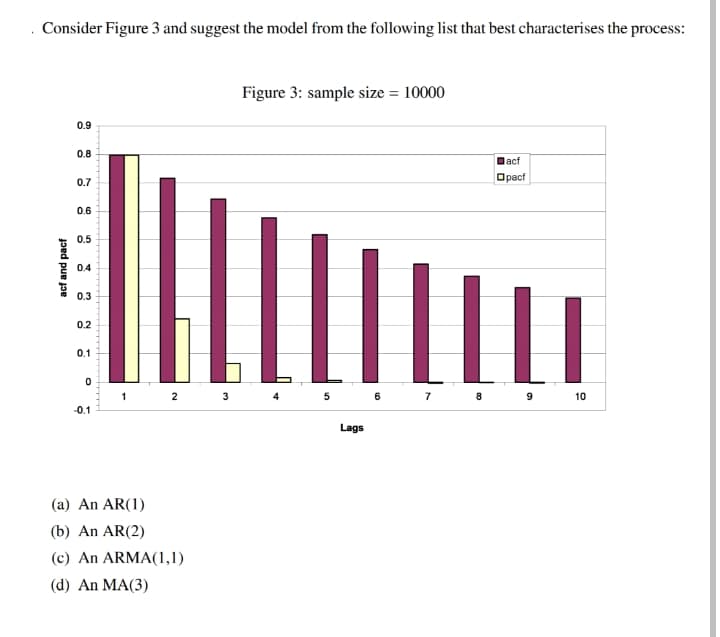
Transcribed Image Text:. Consider Figure 3 and suggest the model from the following list that best characterises the process:
Figure 3: sample size = 10000
0.9
0.8
lacf
Opacf
0.7
0.6
0.5
0.4
0.3
0.2
0.1
2 3
6
1
7
8.
10
-0.1
Lags
(a) An AR(1)
(b) An AR(2)
(c) An ARMA(1,1)
(d) An MA(3)
acf and pacf
t
Expert Solution
This question has been solved!
Explore an expertly crafted, step-by-step solution for a thorough understanding of key concepts.

Step by step
Solved in 2 steps

Knowledge Booster


Learn more about
Need a deep-dive on the concept behind this application? Look no further. Learn more about this topic, management and related others by exploring similar questions and additional content below.Recommended textbooks for you
Understanding Business
Management
ISBN:
9781259929434
Author:
William Nickels
Publisher:
McGraw-Hill Education

Management (14th Edition)
Management
ISBN:
9780134527604
Author:
Stephen P. Robbins, Mary A. Coulter
Publisher:
PEARSON

Spreadsheet Modeling & Decision Analysis: A Pract…
Management
ISBN:
9781305947412
Author:
Cliff Ragsdale
Publisher:
Cengage Learning
Understanding Business
Management
ISBN:
9781259929434
Author:
William Nickels
Publisher:
McGraw-Hill Education
Management (14th Edition)
Management
ISBN:
9780134527604
Author:
Stephen P. Robbins, Mary A. Coulter
Publisher:
PEARSON
Spreadsheet Modeling & Decision Analysis: A Pract…
Management
ISBN:
9781305947412
Author:
Cliff Ragsdale
Publisher:
Cengage Learning

Management Information Systems: Managing The Digi…
Management
ISBN:
9780135191798
Author:
Kenneth C. Laudon, Jane P. Laudon
Publisher:
PEARSON

Business Essentials (12th Edition) (What's New in…
Management
ISBN:
9780134728391
Author:
Ronald J. Ebert, Ricky W. Griffin
Publisher:
PEARSON

Fundamentals of Management (10th Edition)
Management
ISBN:
9780134237473
Author:
Stephen P. Robbins, Mary A. Coulter, David A. De Cenzo
Publisher:
PEARSON