With these limits established, West now takes 5 more hours of data, which are shown in the following table. Calculate the mean and range for each hour that the sample data is taken. (Enter your responses for the mean to one decimal place and enter your responses for the range as whole numbers.) Sample Data Hour Sample Taken 1 26 4. 5 R 57 62 49 68 71 27 55 62 58 56 77 28 72 58 61 54 64 29 67 80 56 63 70 30 56 47 56 65 62 b) Do the samples for hours 26 through 30 indicate that the process is in control? Based on the x-chart, the process has been Based on the R-chart, the process has been
With these limits established, West now takes 5 more hours of data, which are shown in the following table. Calculate the mean and range for each hour that the sample data is taken. (Enter your responses for the mean to one decimal place and enter your responses for the range as whole numbers.) Sample Data Hour Sample Taken 1 26 4. 5 R 57 62 49 68 71 27 55 62 58 56 77 28 72 58 61 54 64 29 67 80 56 63 70 30 56 47 56 65 62 b) Do the samples for hours 26 through 30 indicate that the process is in control? Based on the x-chart, the process has been Based on the R-chart, the process has been

Practical Management Science
6th Edition
ISBN:9781337406659
Author:WINSTON, Wayne L.
Publisher:WINSTON, Wayne L.
Chapter2: Introduction To Spreadsheet Modeling
Section: Chapter Questions
Problem 20P: Julie James is opening a lemonade stand. She believes the fixed cost per week of running the stand...

Related questions
Question
This exercise contains only parts a and b.
a) For the given data, the
x= ____ hours (round your response to three decimal places).
For the given data, mean range =_____
hours (round your response to two decimal places).
hours (round your response to two decimal places).
With
z=3,
the control limits for the mean chart are:UCLx= ____hours (round your response to three decimal places).
LCLx=____hours (round your response to three decimal places).
The control limits for the range chart are:
UCLR=____hours (round your response to two decimal places).
LCLR=h____ours (round your response to two decimal places).
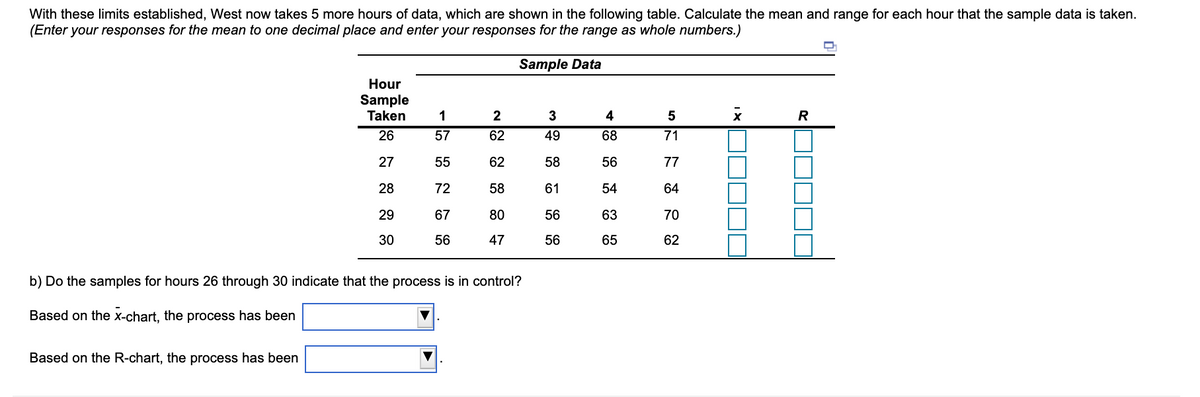
With these limits established, West now takes 5 more hours of data, which are shown in the following table. Calculate the mean and range for each hour that the sample data is taken. (Enter your responses for the mean to one decimal place and enter your responses for the range as whole numbers.)
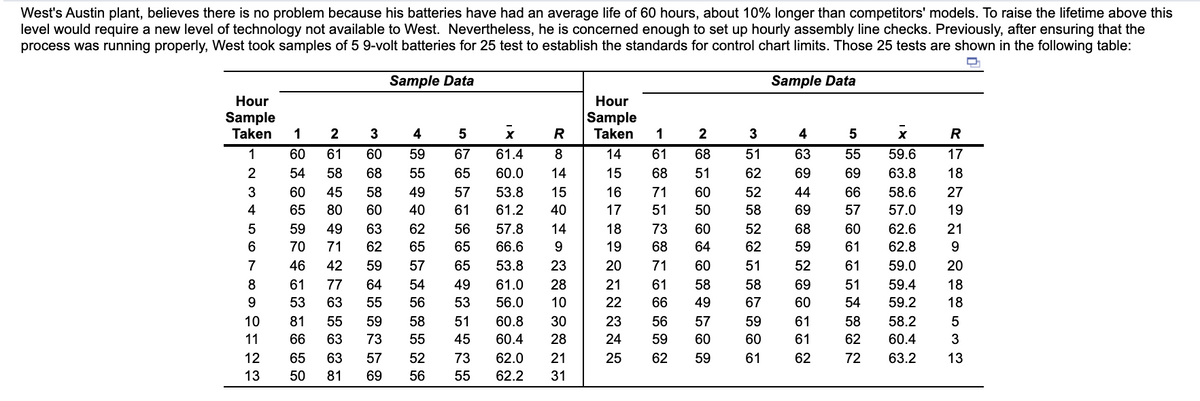
Transcribed Image Text:West's Austin plant, believes there is no problem because his batteries have had an average life of 60 hours, about 10% longer than competitors' models. To raise the lifetime above this
level would require a new level of technology not available to West. Nevertheless, he is concerned enough to set up hourly assembly line checks. Previously, after ensuring that the
process was running properly, West took samples of 5 9-volt batteries for 25 test to establish the standards for control chart limits. Those 25 tests are shown in the following table:
Sample Data
Sample Data
Hour
Hour
Sample
Taken
1
Sample
2
3
4
5
Taken
1
2
3
4
5
R
1
60
61
60
59
67
61.4
8
14
61
68
51
63
55
59.6
17
54
58
68
55
65
60.0
14
15
68
51
62
69
69
63.8
18
60
45
58
49
57
53.8
15
16
71
60
52
44
66
58.6
27
65
80
60
40
61
61.2
40
17
51
50
58
69
57
57.0
19
59
49
63
62
56
57.8
14
18
73
60
52
68
60
62.6
21
70
71
62
65
65
66.6
19
68
64
62
59
61
62.8
9
46
42
59
57
65
53.8
23
20
71
60
51
52
61
59.0
20
61
77
64
54
49
61.0
28
21
61
58
58
69
51
59.4
18
53
63
55
56
53
56.0
10
22
66
49
67
60
54
59.2
18
10
81
55
59
58
51
60.8
30
23
56
57
59
61
58
58.2
11
66
63
73
55
45
60.4
28
24
59
60
60
61
62
60.4
3
65
63
57
52
73
62.0
21
25
62
59
61
62
72
63.2
13
13
50
81
69
56
55
62.2
31
2 3 4 56 7 8 9 은 m 2 2
Transcribed Image Text:With these limits established, West now takes 5 more hours of data, which are shown in the following table. Calculate the mean and range for each hour that the sample data is taken.
(Enter your responses for the mean to one decimal place and enter your responses for the range as whole numbers.)
Sample Data
Hour
Sample
Taken
1
2
3
4
26
57
62
49
68
71
27
55
62
58
56
77
28
72
58
61
54
64
29
67
80
56
63
70
30
56
47
56
65
62
b) Do the samples for hours 26 through 30 indicate that the process is in control?
Based on the x-chart, the process has been
Based on the R-chart, the process has been
Expert Solution
This question has been solved!
Explore an expertly crafted, step-by-step solution for a thorough understanding of key concepts.

This is a popular solution!

Trending now
This is a popular solution!

Step by step
Solved in 2 steps with 7 images

Recommended textbooks for you
Practical Management Science
Operations Management
ISBN:
9781337406659
Author:
WINSTON, Wayne L.
Publisher:
Cengage,

Operations Management
Operations Management
ISBN:
9781259667473
Author:
William J Stevenson
Publisher:
McGraw-Hill Education

Operations and Supply Chain Management (Mcgraw-hi…
Operations Management
ISBN:
9781259666100
Author:
F. Robert Jacobs, Richard B Chase
Publisher:
McGraw-Hill Education
Practical Management Science
Operations Management
ISBN:
9781337406659
Author:
WINSTON, Wayne L.
Publisher:
Cengage,
Operations Management
Operations Management
ISBN:
9781259667473
Author:
William J Stevenson
Publisher:
McGraw-Hill Education
Operations and Supply Chain Management (Mcgraw-hi…
Operations Management
ISBN:
9781259666100
Author:
F. Robert Jacobs, Richard B Chase
Publisher:
McGraw-Hill Education


Purchasing and Supply Chain Management
Operations Management
ISBN:
9781285869681
Author:
Robert M. Monczka, Robert B. Handfield, Larry C. Giunipero, James L. Patterson
Publisher:
Cengage Learning

Production and Operations Analysis, Seventh Editi…
Operations Management
ISBN:
9781478623069
Author:
Steven Nahmias, Tava Lennon Olsen
Publisher:
Waveland Press, Inc.