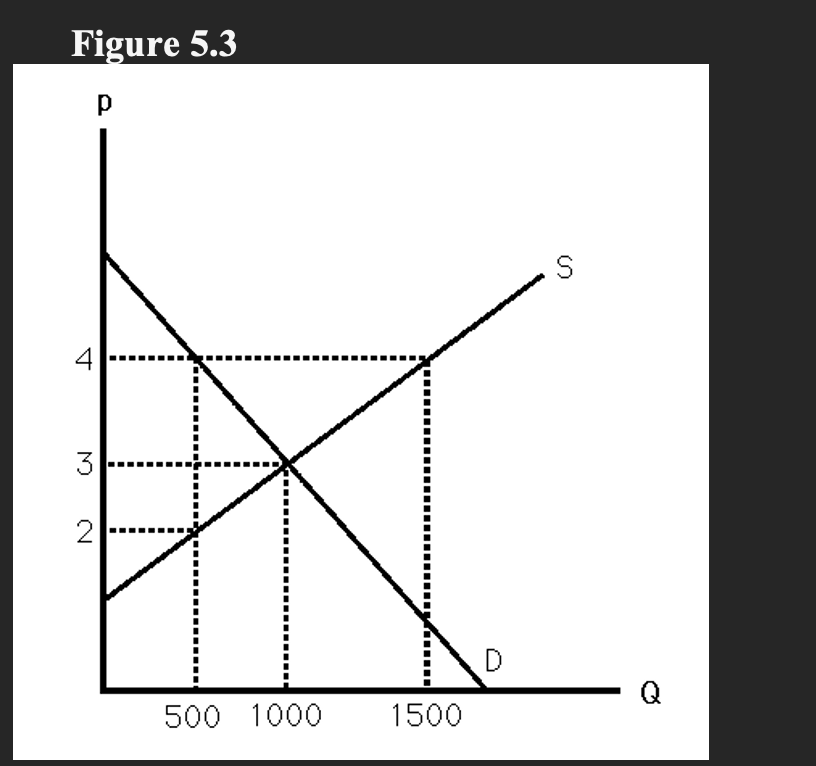
Figure 5.3 shows the demand and supply curves in the market for milk. Currently the market is in equilibrium. If the government establishes a $2 per gallon price ceiling to ensure that children are nourished, estimate the change in p, Q, and social welfare
Figure 5.3 shows the demand and supply curves in the market for milk. Currently the market is in equilibrium. If the government establishes a $2 per gallon price ceiling to ensure that children are nourished, estimate the change in p, Q, and social welfare

Principles of Economics 2e
2nd Edition
ISBN:9781947172364
Author:Steven A. Greenlaw; David Shapiro
Publisher:Steven A. Greenlaw; David Shapiro
Chapter22: Inflation
Section: Chapter Questions
Problem 18RQ: What is deflation?

Related questions
Question
100%
Figure 5.3 shows the demand and supply
Transcribed Image Text:Figure 5.3
p
S
4
3
2
D
Q
500 1000
1500
....--..…----....y....--
Expert Solution
This question has been solved!
Explore an expertly crafted, step-by-step solution for a thorough understanding of key concepts.

This is a popular solution!

Trending now
This is a popular solution!

Step by step
Solved in 2 steps with 1 images

Recommended textbooks for you
Principles of Economics 2e
Economics
ISBN:
9781947172364
Author:
Steven A. Greenlaw; David Shapiro
Publisher:
OpenStax

Economics (MindTap Course List)
Economics
ISBN:
9781337617383
Author:
Roger A. Arnold
Publisher:
Cengage Learning
Principles of Economics 2e
Economics
ISBN:
9781947172364
Author:
Steven A. Greenlaw; David Shapiro
Publisher:
OpenStax
Economics (MindTap Course List)
Economics
ISBN:
9781337617383
Author:
Roger A. Arnold
Publisher:
Cengage Learning