FIGURE 7-3 0.95 Scaling of utilization in scale 0.90 0.85 0.80 0.75 0.70 0.65 0.60 0.55 0.50 0.45 10 15 20 25 30 Number of agents Agent utilization
FIGURE 7-3 0.95 Scaling of utilization in scale 0.90 0.85 0.80 0.75 0.70 0.65 0.60 0.55 0.50 0.45 10 15 20 25 30 Number of agents Agent utilization

Chapter3: Functions
Section3.3: Rates Of Change And Behavior Of Graphs
Problem 27SE: Table 4 gives the population of a town (in thousand) from 2000 to 2008. What was the average rate of...

Related questions
Topic Video
Question
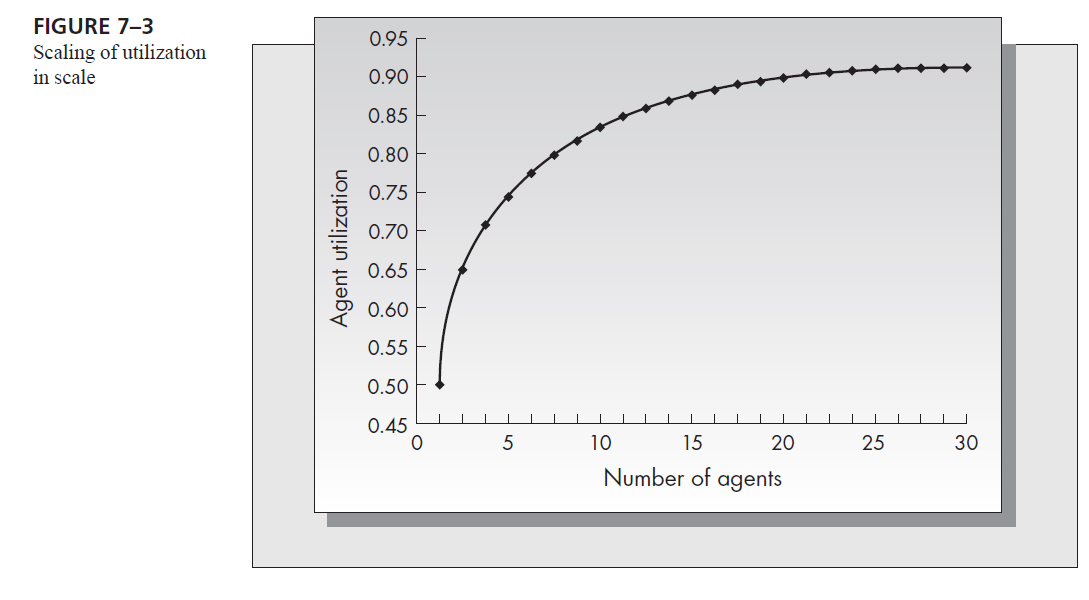
Recreate the given figure for a call center that wants to achieve a 40 percent no hold rate. Suppose that agents only become cost effective (where the revenue they generate exceeds their cost) if they have 90 percent utilization. How large, in terms of number of agents, does the call center need to be to have agents that are generating a positive profit? If mean call time is 5 minutes, what would the arrival rate need to be for 90 percent agent utilization with this many agents?
Transcribed Image Text:FIGURE 7-3
0.95
Scaling of utilization
in scale
0.90
0.85
0.80
0.75
0.70
0.65
0.60
0.55
0.50
0.45
10
15
20
25
30
Number of agents
Agent utilization
Expert Solution
This question has been solved!
Explore an expertly crafted, step-by-step solution for a thorough understanding of key concepts.

This is a popular solution!

Trending now
This is a popular solution!

Step by step
Solved in 3 steps with 1 images

Knowledge Booster


Learn more about
Need a deep-dive on the concept behind this application? Look no further. Learn more about this topic, statistics and related others by exploring similar questions and additional content below.Recommended textbooks for you