Figure shows the graph of the position x as a function of time for an object moving in the straight line (the x-axis). Which of the following graphs best describes the x-component of the velocity as a function of time for this object? OA. OB.
Figure shows the graph of the position x as a function of time for an object moving in the straight line (the x-axis). Which of the following graphs best describes the x-component of the velocity as a function of time for this object? OA. OB.

Glencoe Physics: Principles and Problems, Student Edition
1st Edition
ISBN:9780078807213
Author:Paul W. Zitzewitz
Publisher:Paul W. Zitzewitz
Chapter3: Accelerated Motion
Section: Chapter Questions
Problem 56A

Related questions
Question
100%
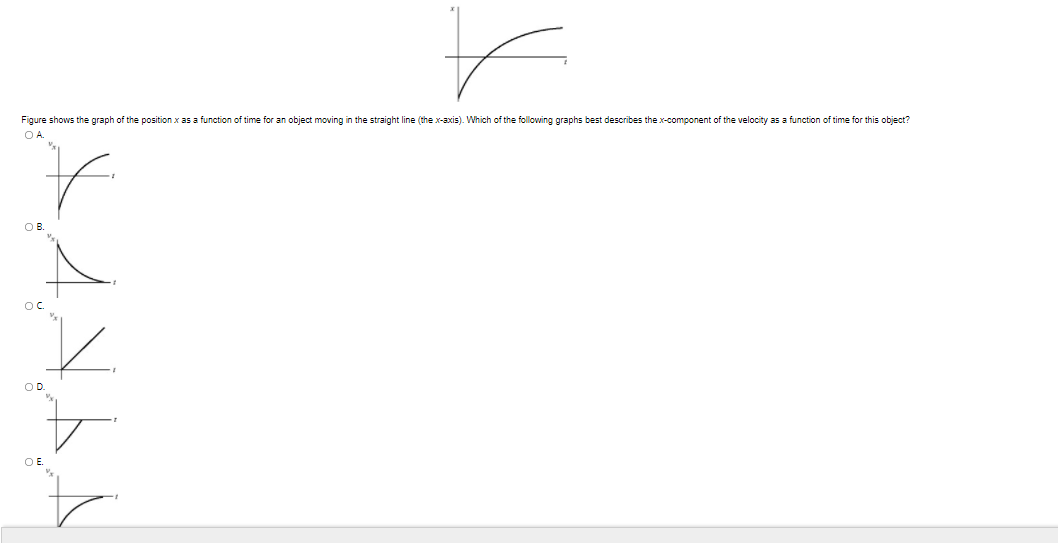
Transcribed Image Text:Figure shows the graph of the position x as a function of time for an object moving in the straight line (the x-axis). Which of the following graphs best describes the x-component of the velocity as a function of time for this object?
OA.
OB.
Expert Solution
This question has been solved!
Explore an expertly crafted, step-by-step solution for a thorough understanding of key concepts.

This is a popular solution!

Trending now
This is a popular solution!

Step by step
Solved in 2 steps

Recommended textbooks for you
Glencoe Physics: Principles and Problems, Student…
Physics
ISBN:
9780078807213
Author:
Paul W. Zitzewitz
Publisher:
Glencoe/McGraw-Hill

Principles of Physics: A Calculus-Based Text
Physics
ISBN:
9781133104261
Author:
Raymond A. Serway, John W. Jewett
Publisher:
Cengage Learning

College Physics
Physics
ISBN:
9781938168000
Author:
Paul Peter Urone, Roger Hinrichs
Publisher:
OpenStax College
Glencoe Physics: Principles and Problems, Student…
Physics
ISBN:
9780078807213
Author:
Paul W. Zitzewitz
Publisher:
Glencoe/McGraw-Hill
Principles of Physics: A Calculus-Based Text
Physics
ISBN:
9781133104261
Author:
Raymond A. Serway, John W. Jewett
Publisher:
Cengage Learning
College Physics
Physics
ISBN:
9781938168000
Author:
Paul Peter Urone, Roger Hinrichs
Publisher:
OpenStax College