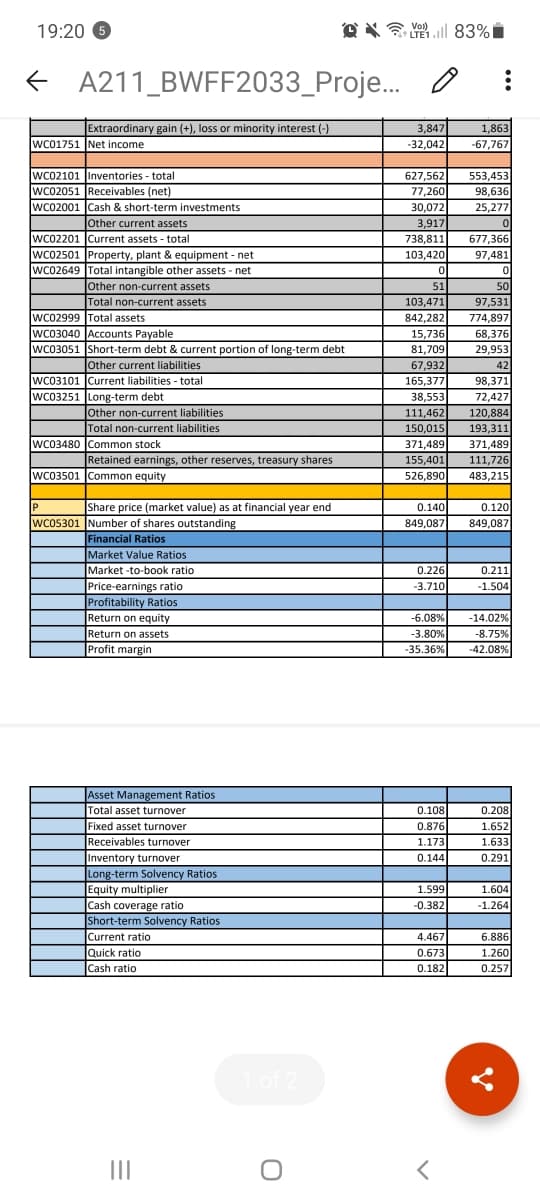
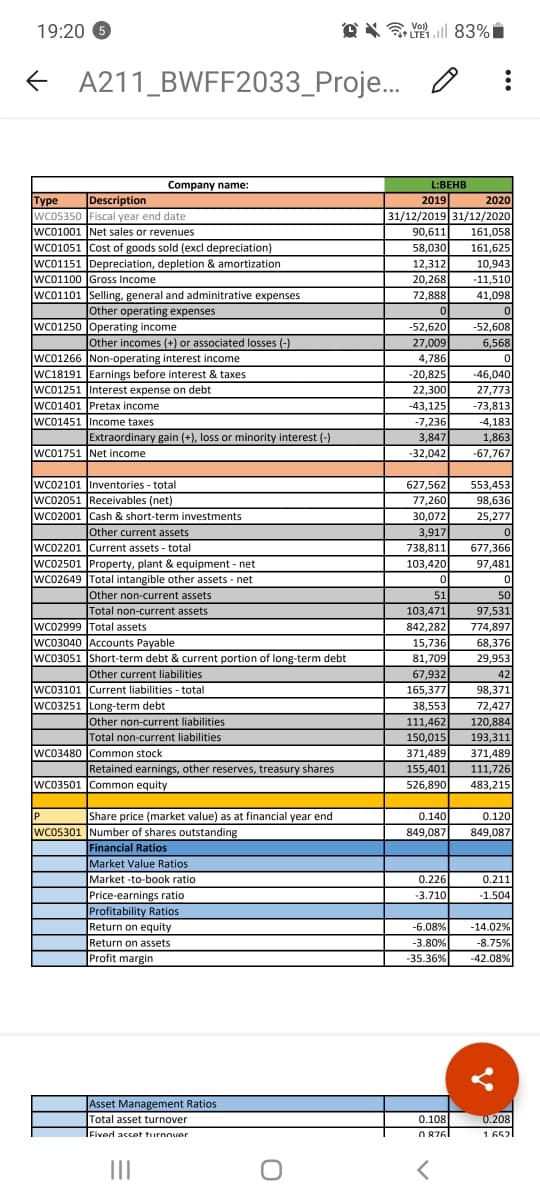
19:20 6 OX M l 83% i LTE1 A211_BWFF2033_Proje.. O Extraordinary gain (+), loss or minority interest (-) 3,847 1,863 wc01751 Net income -32,042 -67,767 WC02101 |Inventories - total wC02051 Receivables (net) 627,562 553,453 77,260 30,072 3,917 98,636 wc02001 Cash & short-term investments Other current assets WC02201 Current assets - total wc02501 Property, plant & equipment - net wc02649 Total intangible other assets - net 25,277 677,366 97,481 738,811 103,420 Other non-current assets 51 50 Total non-current assets 103,471 97,531 WC02999 Total assets WC03040 Accounts Payable wc03051 Short-term debt & current portion of long-term debt 842,282 774,897 15,736 81,709 68,376 29,953 Other current liabilities wC03101 Current liabilities - total WC03251 Long-term debt 67,932 165,377 42 98,371 38,553 72,427 Other non-current liabilities 111,462 150,015 120,884 193,311 Total non-current liabilities WC03480 JCommon stock 371,489 155,401 371,489 Retained earnings, other reserves, treasury shares 111,726 WC03501 Common equity 526,890 483,215 IP 0.120 849,087 Share price (market value) as at financial year end 0.140 wC05301 Number of shares outstanding Financial Ratios Market Value Ratios 849,087 Market -to-book ratio 0.226 0.211 Price-earnings ratio -3.710 -1.504 Profitability Ratios -6.08% -14.02% -8.75% Return on equity Return on assets Profit margin -3.80% -35.36% -42.08% Asset Management Ratios Total asset turnover 0.108 0.208 Fixed asset turnover 0.876 1.652 Receivables turnover 1.173 1.633 0.144 Inventory turnover Long-term Solvency Ratios Equity multiplier Cash coverage ratio Short-term Solvency Ratios Current ratio Quick ratio Cash ratio 0.291 1.599 1.604 -0.382 -1.264 6.886 1.260 4.467 0.673 0.182 0.257 1 of 2 II 103,420 lother non-current assets 677.366 774,897 19:20 6 OX l 83% i Vol) A211_BWFF2033_Proje.. O Company name: L:BEHB Туре Description 2019 2020 31/12/2019 31/12/2020 161,058 161,625 10.943 WC05. W05350 Fiscal year end date wC01001 |Net sales or revenues 90,611 wc01051 Cost of goods sold (excl depreciation) Boous 58,030 WC01151 Depreciation, depletion & amortization 12,312 wC01100 Gross Income 20,200 20,268 -11,510 wc01101 ISelling, general and adminitrative expenses lother operating expenses 72,888 41,098 wc01250 Operating income -52,620 -52,608 6,568 Other incomes (+) or associated losses (-) 27,009 4,786 -20,825 wc01266 Non-operating interest income WC18191 Earnings before interest & taxes Lammgs beid WC01251 Interest expense on debt -46,040 27,773 -73,813 22,300 WC01401 Pretax income -43,125 WC01451 Income taxes -7,236 3,847 -32,042 -4,183 Extraordinary gain (+), loss or minority interest (-) 1,863 -67,767 WC01751 Net income wC02101 Inventories - total wC02051 Receivables (net) wc02001 Cash & short-term investments Other current assets wC02201 Current assets - total 627,562 553,453 98,636 77,260 30,072 25,277 3,917 738,811 103,420 677,366 97,481 wc02501 Property, plant & equipment - net wc02649 Total intangible other assets - net totar itangibie Other non-current assets 51 50 Total non-current assets 103,471 97,531 wc02999 Total assets wC03040 Accounts Payable wc03051 Short-term debt & current portion of long-term debt 842,282 774,897 15,736 81,709 68,376 29,953 Other current liabilities wC03101 Current liabilities - total WC03251 Long-term debt 67,932 165,377 42 98,371 38,553 72,427 120,884 Other non-current liabilities Total non-current liabilities 111,462 150,015 371,489 155,401 526,890 193,311 371,489 111,726 wC03480 Common stock Retained earnings, other reserves, treasury shares WC03501 Common equity 483,215 IP Share price (market value) as at financial year end 0.140 0.120 WC05301 Number of shares outstanding 849,087 849,087 Financial Ratios Market Value Ratios Market -to-book ratio Price-earnings ratio 0.226 0.211 -3.710 -1.504 Profitability Ratios Return on equity -6.08% -14.02% -8.75% Return on assets Profit margin -3.80% 35.36% -42.08% Asset Management Ratios Total asset turnover 0.108 0.208 1 6521 IFived ascet turnover O 8761 II


Reporting Cash Flows
Reporting of cash flows means a statement of cash flow which is a financial statement. A cash flow statement is prepared by gathering all the data regarding inflows and outflows of a company. The cash flow statement includes cash inflows and outflows from various activities such as operating, financing, and investment. Reporting this statement is important because it is the main financial statement of the company.
Balance Sheet
A balance sheet is an integral part of the set of financial statements of an organization that reports the assets, liabilities, equity (shareholding) capital, other short and long-term debts, along with other related items. A balance sheet is one of the most critical measures of the financial performance and position of the company, and as the name suggests, the statement must balance the assets against the liabilities and equity. The assets are what the company owns, and the liabilities represent what the company owes. Equity represents the amount invested in the business, either by the promoters of the company or by external shareholders. The total assets must match total liabilities plus equity.
Financial Statements
Financial statements are written records of an organization which provide a true and real picture of business activities. It shows the financial position and the operating performance of the company. It is prepared at the end of every financial cycle. It includes three main components that are balance sheet, income statement and cash flow statement.
Owner's Capital
Before we begin to understand what Owner’s capital is and what Equity financing is to an organization, it is important to understand some basic accounting terminologies. A double-entry bookkeeping system Normal account balances are those which are expected to have either a debit balance or a credit balance, depending on the nature of the account. An asset account will have a debit balance as normal balance because an asset is a debit account. Similarly, a liability account will have the normal balance as a credit balance because it is amount owed, representing a credit account. Equity is also said to have a credit balance as its normal balance. However, sometimes the normal balances may be reversed, often due to incorrect journal or posting entries or other accounting/ clerical errors.
Ratios refer to establishing the relationship between the two numbers. In accounting, the ratio is used to determine the companies performance in terms of asset usage and management, profitability, and efficiency.

Step by step
Solved in 2 steps with 2 images


