Integrative: Complete ratio analysis Given the following financial statements E, historical ratios, and industry averages , calculate Sterling Company's financial ratios for the most recent year. (Assume a 365-day year.) Analyze its overall financial situation from both a cross-sectional and a time-series viewpoint. Break your analysis into evaluations of the firm's liquidity, activity, debt, profitability, and market. The current ratio is 1.59. (Round to two decimal places.) Data table Time-series analysis of the current ratio: Improving (Select from the drop-down menu.) Cross-sectional analysis of the current ratio: Poor (Select from the drop-down menu.) (Click the icon here O in order to copy the contents of the data table below into a spreadsheet.) The quick ratio is 0.84. (Round to two decimal places.) Historical and Industry Average Ratios for Sterling Company Ratio Actual 2020 Actual 2021 Industry average, 2022 Time-series analysis of the quick ratio: (Select from the drop-down menu.) Current ratio 1.32 1.47 1.77 Quick ratio 0.96 0.88 1.01 Inventory turnover Average collection period Average payment period 9.65 9.34 8.73 Cross-sectional analysis of the quick ratio: (Select from the drop-down menu.) 46.0 days 37.3 days 35.90 days 60.8 days 63.1 days 47.9 days Total asset turnover 0.75 0.81 0.75 Debt ratio 0.20 0.20 0.30 Times interest earned ratio 7.8 6.9 7.6 Fixed-payment coverage ratio Gross profit margin 4.8 4.5 4.5 0.30 0.27 0.25 Operating profit margin Net profit margin 0.12 0.12 0.10 0.085 0.085 0.076 Return on total assets (ROA) Return on common equity (ROE) 0.064 0.069 .059 0.094 0.100 0.099 $2.72 $3.17 $2.47 Earnings per share (EPS) Price/earnings (P/E) ratio Market/book (M/B) ratio 9.1 7.6 8.3 1.28 1.13 1.18
Integrative: Complete ratio analysis Given the following financial statements E, historical ratios, and industry averages , calculate Sterling Company's financial ratios for the most recent year. (Assume a 365-day year.) Analyze its overall financial situation from both a cross-sectional and a time-series viewpoint. Break your analysis into evaluations of the firm's liquidity, activity, debt, profitability, and market. The current ratio is 1.59. (Round to two decimal places.) Data table Time-series analysis of the current ratio: Improving (Select from the drop-down menu.) Cross-sectional analysis of the current ratio: Poor (Select from the drop-down menu.) (Click the icon here O in order to copy the contents of the data table below into a spreadsheet.) The quick ratio is 0.84. (Round to two decimal places.) Historical and Industry Average Ratios for Sterling Company Ratio Actual 2020 Actual 2021 Industry average, 2022 Time-series analysis of the quick ratio: (Select from the drop-down menu.) Current ratio 1.32 1.47 1.77 Quick ratio 0.96 0.88 1.01 Inventory turnover Average collection period Average payment period 9.65 9.34 8.73 Cross-sectional analysis of the quick ratio: (Select from the drop-down menu.) 46.0 days 37.3 days 35.90 days 60.8 days 63.1 days 47.9 days Total asset turnover 0.75 0.81 0.75 Debt ratio 0.20 0.20 0.30 Times interest earned ratio 7.8 6.9 7.6 Fixed-payment coverage ratio Gross profit margin 4.8 4.5 4.5 0.30 0.27 0.25 Operating profit margin Net profit margin 0.12 0.12 0.10 0.085 0.085 0.076 Return on total assets (ROA) Return on common equity (ROE) 0.064 0.069 .059 0.094 0.100 0.099 $2.72 $3.17 $2.47 Earnings per share (EPS) Price/earnings (P/E) ratio Market/book (M/B) ratio 9.1 7.6 8.3 1.28 1.13 1.18

Financial Management: Theory & Practice
16th Edition
ISBN:9781337909730
Author:Brigham
Publisher:Brigham
Chapter3: Analysis Of Financial Statements
Section: Chapter Questions
Problem 14P: The Jimenez Corporation’s forecasted 2020 financial statements follow, along with some industry...

Related questions
Question
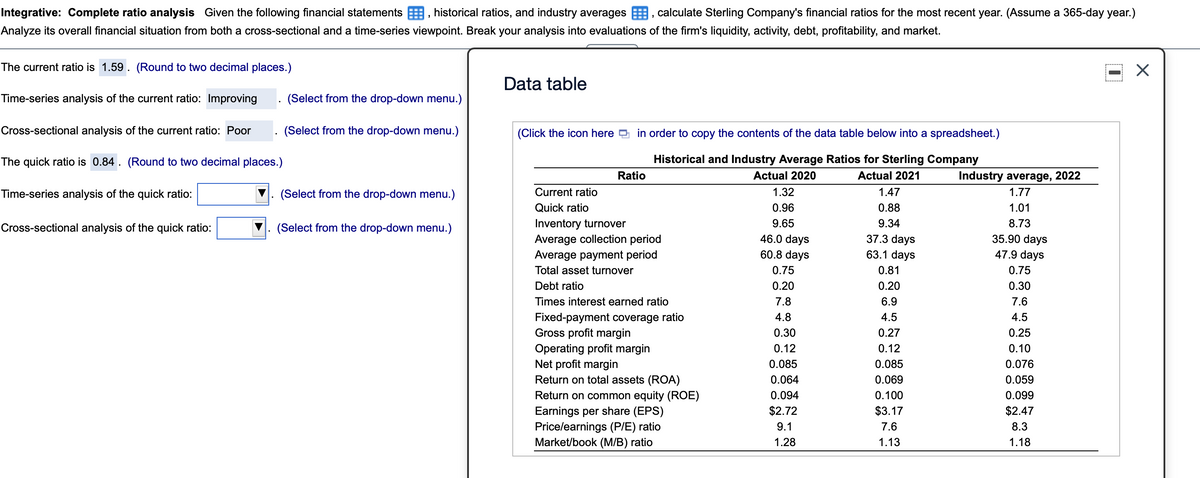
Transcribed Image Text:Integrative: Complete ratio analysis Given the following financial statements E, historical ratios, and industry averages , calculate Sterling Company's financial ratios for the most recent year. (Assume a 365-day year.)
Analyze its overall financial situation from both a cross-sectional and a time-series viewpoint. Break your analysis into evaluations of the firm's liquidity, activity, debt, profitability, and market.
The current ratio is 1.59. (Round to two decimal places.)
Data table
Time-series analysis of the current ratio: Improving
(Select from the drop-down menu.)
Cross-sectional analysis of the current ratio: Poor
(Select from the drop-down menu.)
(Click the icon here O in order to copy the contents of the data table below into a spreadsheet.)
The quick ratio is 0.84. (Round to two decimal places.)
Historical and Industry Average Ratios for Sterling Company
Ratio
Actual 2020
Actual 2021
Industry average, 2022
Time-series analysis of the quick ratio:
(Select from the drop-down menu.)
Current ratio
1.32
1.47
1.77
Quick ratio
0.96
0.88
1.01
Inventory turnover
Average collection period
Average payment period
9.65
9.34
8.73
Cross-sectional analysis of the quick ratio:
(Select from the drop-down menu.)
46.0 days
37.3 days
35.90 days
60.8 days
63.1 days
47.9 days
Total asset turnover
0.75
0.81
0.75
Debt ratio
0.20
0.20
0.30
Times interest earned ratio
7.8
6.9
7.6
Fixed-payment coverage ratio
Gross profit margin
4.8
4.5
4.5
0.30
0.27
0.25
Operating profit margin
Net profit margin
0.12
0.12
0.10
0.085
0.085
0.076
Return on total assets (ROA)
Return on common equity (ROE)
0.064
0.069
.059
0.094
0.100
0.099
$2.72
$3.17
$2.47
Earnings per share (EPS)
Price/earnings (P/E) ratio
Market/book (M/B) ratio
9.1
7.6
8.3
1.28
1.13
1.18
Expert Solution
This question has been solved!
Explore an expertly crafted, step-by-step solution for a thorough understanding of key concepts.

This is a popular solution!

Trending now
This is a popular solution!

Step by step
Solved in 2 steps

Knowledge Booster


Learn more about
Need a deep-dive on the concept behind this application? Look no further. Learn more about this topic, accounting and related others by exploring similar questions and additional content below.Recommended textbooks for you

Managerial Accounting: The Cornerstone of Busines…
Accounting
ISBN:
9781337115773
Author:
Maryanne M. Mowen, Don R. Hansen, Dan L. Heitger
Publisher:
Cengage Learning

Managerial Accounting
Accounting
ISBN:
9781337912020
Author:
Carl Warren, Ph.d. Cma William B. Tayler
Publisher:
South-Western College Pub
Managerial Accounting: The Cornerstone of Busines…
Accounting
ISBN:
9781337115773
Author:
Maryanne M. Mowen, Don R. Hansen, Dan L. Heitger
Publisher:
Cengage Learning
Managerial Accounting
Accounting
ISBN:
9781337912020
Author:
Carl Warren, Ph.d. Cma William B. Tayler
Publisher:
South-Western College Pub

Cornerstones of Financial Accounting
Accounting
ISBN:
9781337690881
Author:
Jay Rich, Jeff Jones
Publisher:
Cengage Learning

Financial And Managerial Accounting
Accounting
ISBN:
9781337902663
Author:
WARREN, Carl S.
Publisher:
Cengage Learning,

Financial Accounting
Accounting
ISBN:
9781337272124
Author:
Carl Warren, James M. Reeve, Jonathan Duchac
Publisher:
Cengage Learning