Find a formula for a power function that models the following data. (Round the regression parameters to two decimal places.) f(x) = f = 0.4 x x2.26 f = 0.31 x x2.4 f = 0.3 x x2.35 f = 0.33 x x2-.32 O f = 0.39 xx2.28 х 2 4 4.6 0.3 1.8 8.1 12.3
Find a formula for a power function that models the following data. (Round the regression parameters to two decimal places.) f(x) = f = 0.4 x x2.26 f = 0.31 x x2.4 f = 0.3 x x2.35 f = 0.33 x x2-.32 O f = 0.39 xx2.28 х 2 4 4.6 0.3 1.8 8.1 12.3

Functions and Change: A Modeling Approach to College Algebra (MindTap Course List)
6th Edition
ISBN:9781337111348
Author:Bruce Crauder, Benny Evans, Alan Noell
Publisher:Bruce Crauder, Benny Evans, Alan Noell
Chapter5: A Survey Of Other Common Functions
Section5.6: Higher-degree Polynomials And Rational Functions
Problem 1TU: The following fictitious table shows kryptonite price, in dollar per gram, t years after 2006. t=...

Related questions
Question
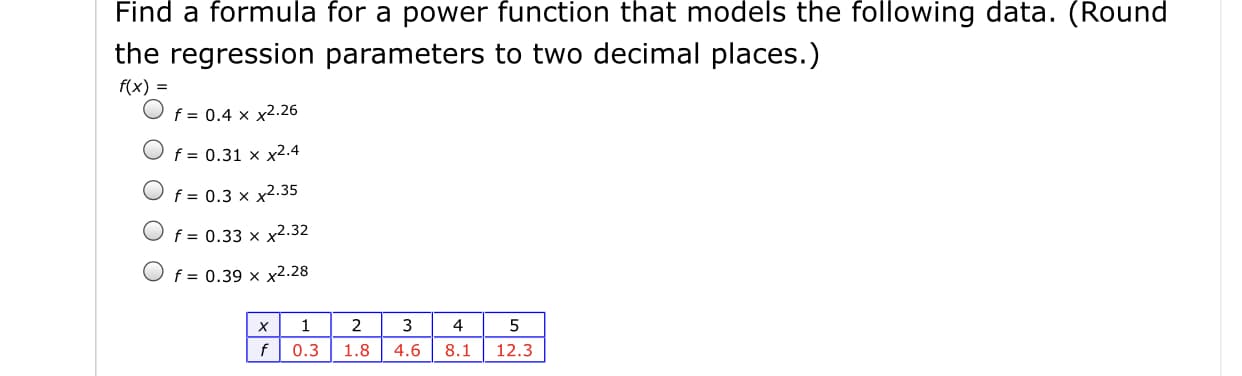
Transcribed Image Text:Find a formula for a power function that models the following data. (Round
the regression parameters to two decimal places.)
f(x) =
f = 0.4 x x2.26
f = 0.31 x x2.4
f = 0.3 x x2.35
f = 0.33 x x2-.32
O f = 0.39 xx2.28
х
2
4
4.6
0.3
1.8
8.1
12.3
Expert Solution
This question has been solved!
Explore an expertly crafted, step-by-step solution for a thorough understanding of key concepts.

This is a popular solution!

Trending now
This is a popular solution!

Step by step
Solved in 4 steps with 1 images

Recommended textbooks for you
Functions and Change: A Modeling Approach to Coll…
Algebra
ISBN:
9781337111348
Author:
Bruce Crauder, Benny Evans, Alan Noell
Publisher:
Cengage Learning

Algebra & Trigonometry with Analytic Geometry
Algebra
ISBN:
9781133382119
Author:
Swokowski
Publisher:
Cengage

Functions and Change: A Modeling Approach to Coll…
Algebra
ISBN:
9781337111348
Author:
Bruce Crauder, Benny Evans, Alan Noell
Publisher:
Cengage Learning
Algebra & Trigonometry with Analytic Geometry
Algebra
ISBN:
9781133382119
Author:
Swokowski
Publisher:
Cengage

Linear Algebra: A Modern Introduction
Algebra
ISBN:
9781285463247
Author:
David Poole
Publisher:
Cengage Learning

College Algebra
Algebra
ISBN:
9781305115545
Author:
James Stewart, Lothar Redlin, Saleem Watson
Publisher:
Cengage Learning