3. Determine the equation of the exponential regression function for the data. Round all values to the nearest hundredth. -2 -1 1 3 8.2 5.6 3.8 2.6 1.8 1.2
Q: (e) What proportion of the observed variation in runoff volume can be attributed to the simple…
A: the data shows the rainfall volume and runoff volume.
Q: A set of n = 15 pairs of X and Y scores has SSX = 10, SSY = 40, and SP = 30. What is the slope for…
A:
Q: The local coffee shop keeps track of how much coffee they sell versus the temperature on that day,…
A: Given: Sample size n = 6 Formula Used: The equation of regression line is: Y = a + bX Where, b is…
Q: Using the data from the previous problem, answer the following questions in the text box below. You…
A: From given data, X Y X*Y X*X Y*Y 5 3.5 17.5 25 12.25 7 3.3 23.1 49 10.89 10 2.7 27 100 7.29…
Q: The local coffee shop keeps track of how much coffee they sell versus the temperature on that day,…
A: Regression equation is used to predict the variable based on the another variable. It explain the…
Q: d. What percentage of the variation in calorie intake is explained by the regression model? Answer…
A: Given : Running Time (x) Calorie Intake (y) 25 210 35 285 28 225 18 215…
Q: Use these data and multiple regression to make predictions of the motel chain’s revenues during the…
A: Note: Hi there! Thank you for posting the question. As you have posted multiple questions, as per…
Q: You are giving the regression equation of how the sales trend varies with time: y= 300 + 25x Where:…
A:
Q: The table below shows the population of a fictional California Gold Rush Town named Lehi in the…
A: Hello. Since your question has multiple parts, we will solve the first part for you. If you want…
Q: Hours (x) Average Number of Spores (y) 4 0 0.5 1 2 23 4 6 10 15 60 260 1130 16,380
A: Concept: Here the curve fitted is y=aebx taking log both sides we have…
Q: 10. For the table below, find a linear regression model to predict the number of unemployed in this…
A:
Q: The annual profits for a company are given in the following table, where x represents the number of…
A: Given that x represents the number of years since 2007, and y represents the profit in thousands of…
Q: The accompanying table shows the value of a car over tíme that was purchased for 15700 dollars,…
A:
Q: The relationship between income a and expenditure y was estimated by the following regression…
A:
Q: Find the multiple regression equation for the data given below. 2 -2 -1 1 2 -3 1 0 -1 2 2 -13 -4 11…
A:
Q: The following table shows the time a student spends studying for a test in hours and the grade they…
A: Given, Study Grade 2 84 4.5 91 5 92 3 89 4.25 88 4 93 1 68 2 76 5 94 2.5 87
Q: The linear regression equation for a data set is ŷ = – 4.1 + 1.6x. The actual value at x = 9 is 11.…
A:
Q: Example Find the regression equation Y on X for the following data. X: 2 4 6. 8 Y: 15 20 25
A:
Q: The price of a movie ticket in a given year can be modeled by the regression equation y 6.94(1.02*),…
A: The regression equation is y = 6.94(1.02x), where x is the year and y is the ticket price.
Q: (d) If the life expectancy is increased by 4 years in a certain country, how much will the happiness…
A: Provided information is ; regression line is y^ = a + b x where ; y = happiness index…
Q: Find the regression equation for the following paired data. (1, 2), (3, 7), (5, 9), (9, 15), (4, 7)
A: The equation is obtained by creating a table as follows: x y xy x2 y2 1 2 2 1 4 3 7 21 9 49…
Q: The annual profits for a company are given in the following table, where x represents the number of…
A: We know that, Linear regression equation is given by,
Q: (d) (e) Calculate the coefficient of Pearson correlation. If the surrounding temperature in the…
A: Followings are the Explanation of the question
Q: The annual profits for a company are given in the following table, where x represents the number of…
A:
Q: What is the exponential regression of the data? x y -3 0.0740740740740741 -2 0.222222222222222 -1…
A: We know the formula for exponential regression is given as : y = a×bx by putting values of x and y…
Q: Owen invested $2 000 three years ago. He has been tracking the investment by recording its value at…
A: Let ' X ' represent the year number and ' Y ' be the value of the investment
Q: Q3/ The owner of a company would like to review the relationship between years on the job and weekly…
A:
Q: 1. Which quantity is the independent variable? O average mid-career salary of graduates O annual…
A:
Q: The annual profits for a company are given in the following table, where x represents the number of…
A: Given Data : X = Years since 2006 Y = Profits 0 117 1 122 2 136 3 170 4 166 5 198…
Q: The table to the right shows the number of internet hosts from 1994 to 2012. (A) Let x represent the…
A:
Q: 1 A cup of soup is left on a countertop to cool. The table below gives the temperatures, in degrees…
A: We have to find exponential regression equation
Q: Forecast sales in the coming year (Year 5) using the regression results above.
A: The trend equation is given by S = -1.1t +110.9 where intercept is 110.9 and coefficient of year is…
Q: 0.6. Calculate regression equation from the following and take deviation from x =7 and y = 5: x = 4…
A:
Q: Write an exponential regression equation for the following data, rounding all coefficients to the…
A: Solution: The curve to be fitted is y=aebx taking logarithm on both sides, we get…
Q: Determine the exponential regression equation for the data in the accompanying table. [Round the…
A: To find the exponential function from the given table
Q: d) Find the regression equation for the data. e) What resale value would you expect for a car aged…
A: Given: Age Value 1 15975 2 9285 3 8000 4 6790 5 3150 6 3448 7 2755 8 1995 9…
Q: Determine the exponential regression equation for the data in the accompanying table. [Round the…
A: An exponential regression is the process of finding the equation of the exponential function that…
Q: Find the exponential function that models the data in the table below. - 3 - 2 - 1 1 2 3 4 4 y 4 12…
A: Given a dataset where an exponential function y=abx where a and b are constants. are to be obtained.…
Q: a. What is the value of a? b. What is the value of b? c. What is the regression equation?
A: Since you have posted multiple subparts , we will solve first three subparts for you. To get the…
Q: Owen invested $2 000 three years ago. He has been tracking the investment by recording its value at…
A:
Q: Using the previous regression model, what salary would you expect a student with a 3.1 GPA to…
A:
Q: Use the given data to find the best predicted value. If the prediction is unreliable, state so. 5)…
A: Given,y^=55.8+2.79x
Q: In which of the following situations can multiple regression be performed? Select all that apply.
A:
Q: Suppose Ms. Carr is interested in the relationship between her students' 9th grade math final exam…
A: The linear regression equation is given as follows: y^ = 1.48x+75.64 Here, y^ = The predicted final…
Q: What is the exponential regression equation to best fit the data where the y values were rounded to…
A: A will be the right answer.
Q: The percentage of adults who smoke in America is given below. Year America 1970 37.4 1980 33.2 1990…
A: Note: Hi there! Thank you for posting the question. As there are multiple sub parts, according to…
Q: For the data in the table, find the regression equation. Here, x gives the number of years of…
A: First we have to find the regression equation. The Python code for finding the regression equation…
Q: What is the regression equation? ý=D+Ox (Round to one decimal place as needed.) What is the best…
A:
Q: Write an exponential regression equation for the following data, rounding all coefficients to the…
A: Given the data, x 3 6 10 14 17 21 23 y 475 402 321 243 193 153 140 To find: The exponential…
Q: 1 A cup of soup is left on a countertop to cool. The table below gives the temperatures, in degrees…
A: The given data is, Time in minutes(x) Temperature in °F (y) 0 180.2 2 165.8 4 146.3 6…
neat and clean answer
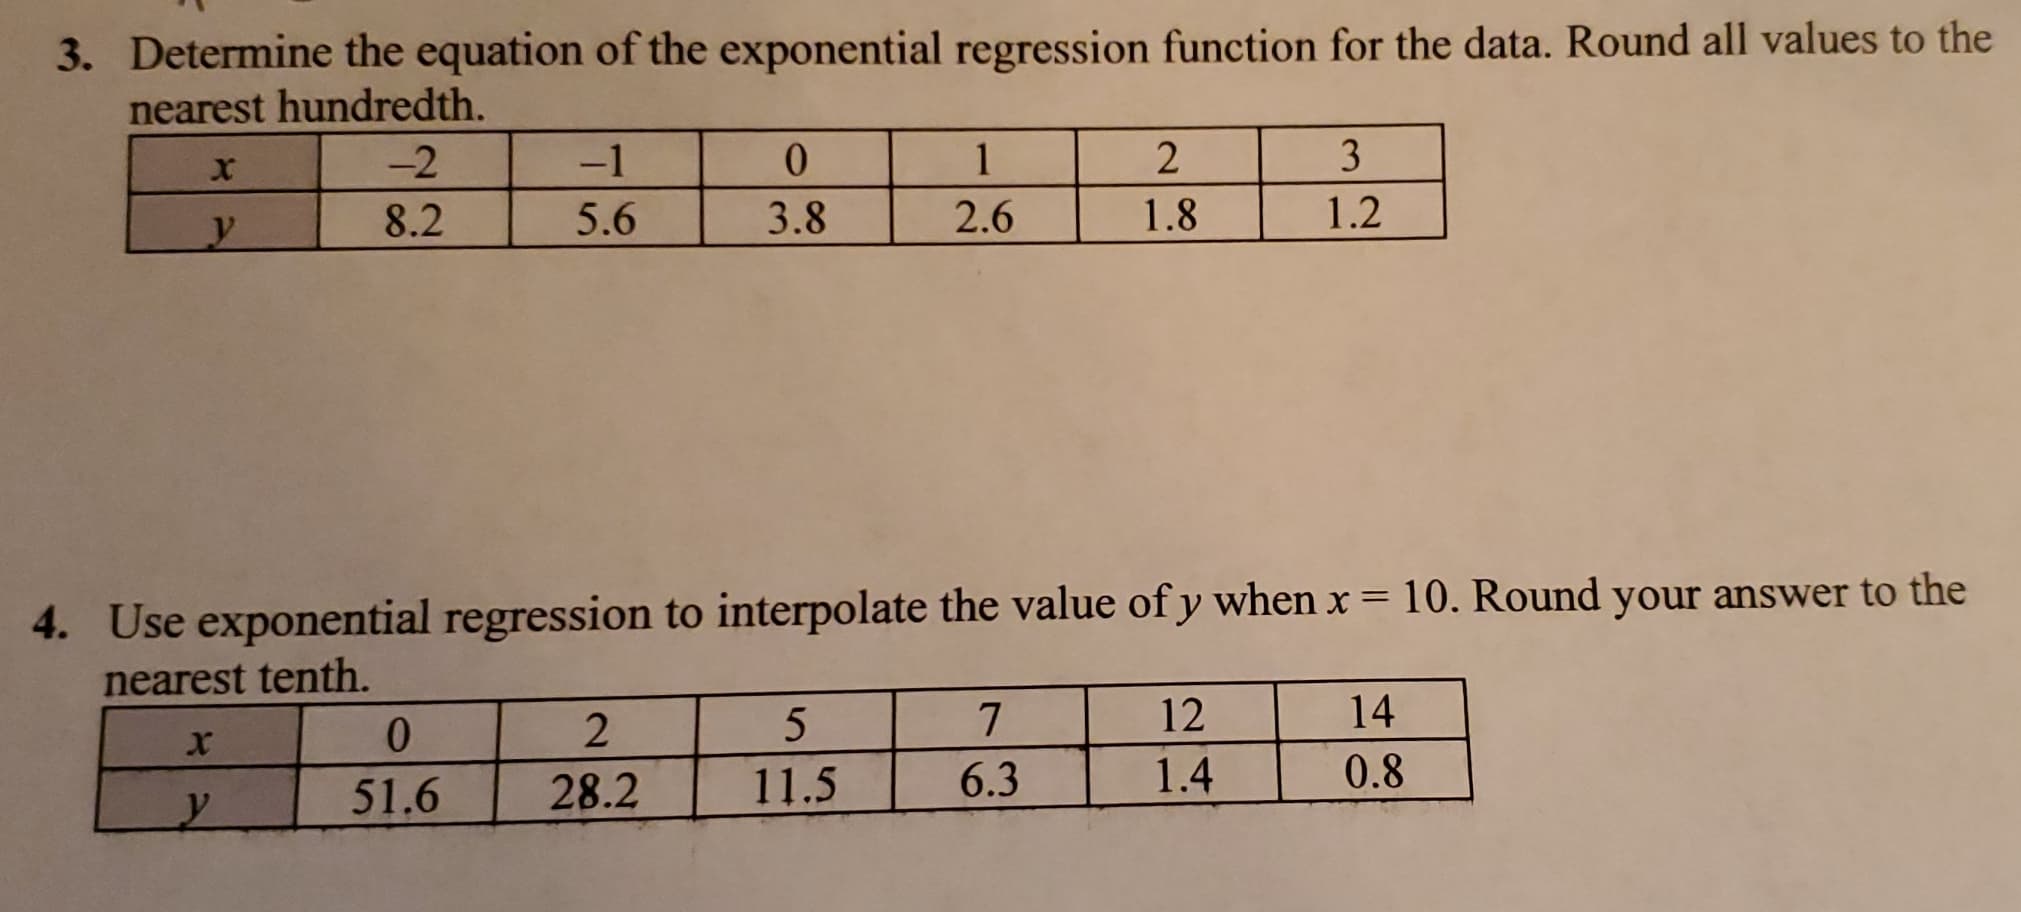
Trending now
This is a popular solution!
Step by step
Solved in 2 steps
- Olympic Pole Vault The graph in Figure 7 indicates that in recent years the winning Olympic men’s pole vault height has fallen below the value predicted by the regression line in Example 2. This might have occurred because when the pole vault was a new event there was much room for improvement in vaulters’ performances, whereas now even the best training can produce only incremental advances. Let’s see whether concentrating on more recent results gives a better predictor of future records. (a) Use the data in Table 2 (page 176) to complete the table of winning pole vault heights shown in the margin. (Note that we are using x=0 to correspond to the year 1972, where this restricted data set begins.) (b) Find the regression line for the data in part ‚(a). (c) Plot the data and the regression line on the same axes. Does the regression line seem to provide a good model for the data? (d) What does the regression line predict as the winning pole vault height for the 2012 Olympics? Compare this predicted value to the actual 2012 winning height of 5.97 m, as described on page 177. Has this new regression line provided a better prediction than the line in Example 2?Table 2 shows a recent graduate’s credit card balance each month after graduation. a. Use exponential regression to fit a model to these data. b. If spending continues at this rate, what will the graduate’s credit card debt be one year after graduating?Special Rounding Instructions When you perform logistic regression, round the r value to three decimal places and the other parameters to two decimal places. Round all answers to two decimal places unless other-wise indicated. Fluorescent Bulbs Compact fluorescent light bulbs save energy when compared with traditional incandescent bulbs. Our green energy campaign includes efforts to get local residents to exchange their incandescent bulbs fur fluorescent bulbs. Initially 200 households make the change. Market studies suggest that, in the absence of limiting factors, we could increase that number by 25 each month. In our target area, there are 250,000 households, which we take as the limiting value. Make a logistic model that gives the number of households converting to fluorescent bulbs after t months.
- Special Rounding Instructions When you perform logistic regression, round the r value to three decimal places and the other parameters to two decimal places. Round all answers to two decimal places unless other-wise indicated. An Epidemic In a city of half a million, there are initially 800 cases of a particularly virulent strain of flu. The Centers for Disease Control and Prevention in Atlanta claims that the cumulative number of infections with this flu strain will increase by 40 per week if there are no limiting factors. Make a logistic model of the potential cumulative number of cases of flu as a function of weeks from initial outbreak, and determine how long it will be before 100, 000 people are infected.The table below shows the results of an experiment involving the growth of bacteria. Write a power regression equation for this set of data, rounding all values to three decimal places. Using this equation, predict the following… The bacteria’s growth, to the nearest integer, after 15 minutes. The amount of time, to the nearest minute, for there to be 4,000 bacteria present.A social science professor wants to determine if the amount of time that a student, who is in a relationship, spends with his or her partner is related to that same student’s academic performance. A random sample of students who are in a relationship has been taken, and the table below shows the amount of time (in hours) spent by each sample on his or her partner in a week, as well as the average grade (with 75.00 as the passing mark). a. Find the regression equation and construct the scatter plot diagram.b. Predict the grade of a student who spends 118.72 hours per week on his or her partner.c. Calculate the total variation.d. Compute the standard deviation of the estimate.
- A researcher investigates the relationship between cigarette smoking (X) and work absences (Y). The number of cigarettes smoked daily and the number of days absent from work due to illness are collected for N= 12 employees. The preliminary results are below: What is the regression equation? How many absences (Y) would expect someone who smokes X = 10 cigarettes a day to have?Using the previous regression model, what salary would you expect a 23 year old male student with a 3.5 GPA to expect? Round your answer to 1 decimal and express in $1,000's (same format the Salary variable has in the Excel dataset, so $50,000 would be 50.0).wrie down the estimated regression equation?
- The following data came from 6 people randomly selected from a population of children between the ages of 10 and 17. It shows their age and the number of push-ups they can do. Based on the linear regression equation, what expectation, on average, would we have for the number of push-ups 15-year olds can do? Round to the nearest whole number.Suppose that a simple linear regression model is appropriate for describing the relationship between y = house price and x = house size (sq ft) for houses in a large city. The true regression line is y = 23,000 + 48x and ? = 4000. (a) What is the average change in price associated with one extra sq ft of space?$ With an additional 100 sq ft of space?$ (b) What proportion of 1800 sq ft homes would be priced over $110,000? (Round your answer to four decimal places.)Under $100,000? (Round your answer to four decimal places.)Imagine a regression line that relates y = average systolic blood pressure to x = age. The average blood pressure for people 40 years old is 90, while for those 55 years old the average is 130. What is the estimated average systolic blood pressure for people who are 50 years old? (Round the answer to the nearest whole number.)