Find out the correlation that can be observed in the following data: Year 1990 2000 2007 2008 2009 2010 2011 2012 1509 2141 2813 2769 2960 3000 3058 3118 Population (thousands) O Strong positive correlation O Weak positive correlation O Strong negative correlation No correlation
Find out the correlation that can be observed in the following data: Year 1990 2000 2007 2008 2009 2010 2011 2012 1509 2141 2813 2769 2960 3000 3058 3118 Population (thousands) O Strong positive correlation O Weak positive correlation O Strong negative correlation No correlation

Glencoe Algebra 1, Student Edition, 9780079039897, 0079039898, 2018
18th Edition
ISBN:9780079039897
Author:Carter
Publisher:Carter
Chapter4: Equations Of Linear Functions
Section4.5: Correlation And Causation
Problem 20HP

Related questions
Question
L4Q3.Find out the
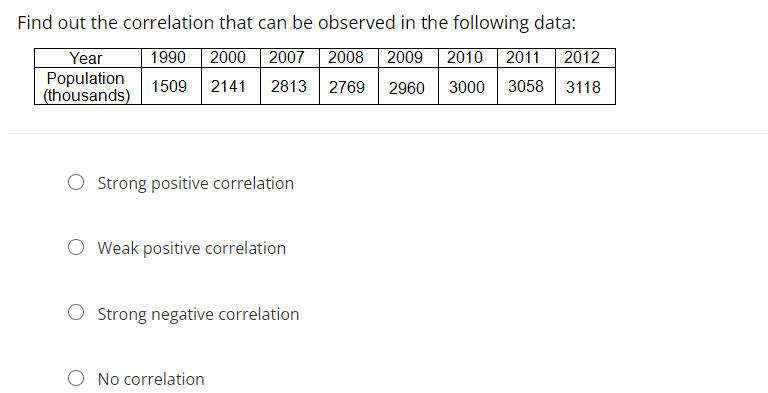
Transcribed Image Text:Find out the correlation that can be observed in the following data:
Year
1990 2000 2007
Population 1509 2141
(thousands)
2008 2009 2010 2011 2012
2769 2960 3000 3058 3118
2813
O Strong positive correlation
Weak positive correlation
O Strong negative correlation
O No correlation
Expert Solution
This question has been solved!
Explore an expertly crafted, step-by-step solution for a thorough understanding of key concepts.

Step by step
Solved in 2 steps with 1 images

Recommended textbooks for you
Glencoe Algebra 1, Student Edition, 9780079039897…
Algebra
ISBN:
9780079039897
Author:
Carter
Publisher:
McGraw Hill

Big Ideas Math A Bridge To Success Algebra 1: Stu…
Algebra
ISBN:
9781680331141
Author:
HOUGHTON MIFFLIN HARCOURT
Publisher:
Houghton Mifflin Harcourt
Glencoe Algebra 1, Student Edition, 9780079039897…
Algebra
ISBN:
9780079039897
Author:
Carter
Publisher:
McGraw Hill
Big Ideas Math A Bridge To Success Algebra 1: Stu…
Algebra
ISBN:
9781680331141
Author:
HOUGHTON MIFFLIN HARCOURT
Publisher:
Houghton Mifflin Harcourt