Find the (a) mean, (b) median, (c) mode, and (d) midrange for the given sample data. An experiment was conducted to determine whether a deficiency of carbon dioxide in the soil affects the phenotype of peas. Listed below are the phenotype codes where 1=smooth-yellow, 2= smooth-green, 3= wrinkled-yellow, and 4=wrinkled-green. Do the results make sense? 1 3 3 2 3 2 1 2 (a) The mean phenotype code is. (Round to the nearest tenth as needed.) (b) The median phenotype code is (Type an integer or a decimal.) (c) Select the correct choice below and fill in any answer boxes within your choice. O A. The mode phenotype code is (Use a comma to separate answers as needed.) O B. There is no mode. (d) The midrange of the phenotype codes is (Type an integer or a decimal.) Do the measures of center make sense? O A. All the measures of center make sense since the data is numerical. O B. Only the mean, median, and midrange make sense since the data is nominal. OC. Only the mode makes sense since the data is nominal. O D. Only the mean, median, and mode make sense since the data is numerical.
Find the (a) mean, (b) median, (c) mode, and (d) midrange for the given sample data. An experiment was conducted to determine whether a deficiency of carbon dioxide in the soil affects the phenotype of peas. Listed below are the phenotype codes where 1=smooth-yellow, 2= smooth-green, 3= wrinkled-yellow, and 4=wrinkled-green. Do the results make sense? 1 3 3 2 3 2 1 2 (a) The mean phenotype code is. (Round to the nearest tenth as needed.) (b) The median phenotype code is (Type an integer or a decimal.) (c) Select the correct choice below and fill in any answer boxes within your choice. O A. The mode phenotype code is (Use a comma to separate answers as needed.) O B. There is no mode. (d) The midrange of the phenotype codes is (Type an integer or a decimal.) Do the measures of center make sense? O A. All the measures of center make sense since the data is numerical. O B. Only the mean, median, and midrange make sense since the data is nominal. OC. Only the mode makes sense since the data is nominal. O D. Only the mean, median, and mode make sense since the data is numerical.

Glencoe Algebra 1, Student Edition, 9780079039897, 0079039898, 2018
18th Edition
ISBN:9780079039897
Author:Carter
Publisher:Carter
Chapter10: Statistics
Section10.5: Comparing Sets Of Data
Problem 14PPS

Related questions
Question
Solve both
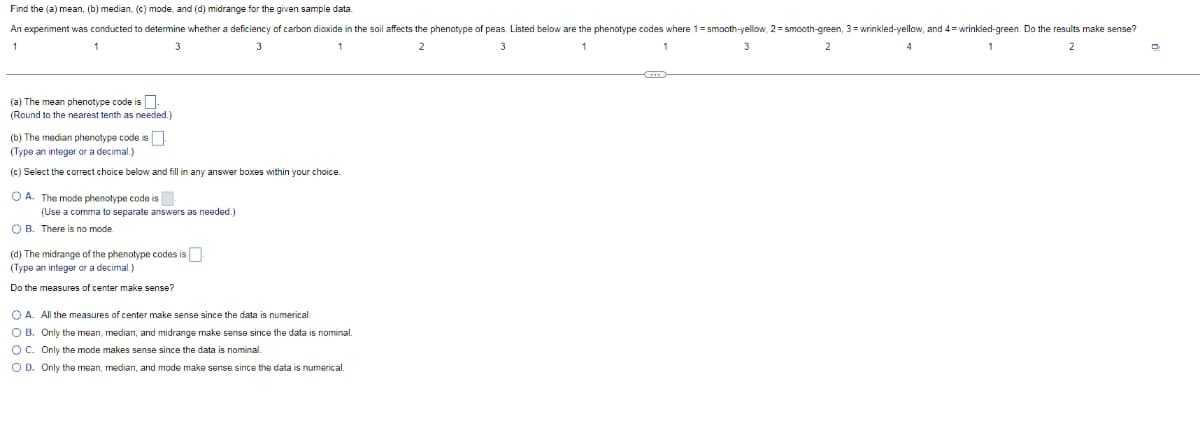
Transcribed Image Text:Find the (a) mean, (b) median, (c) mode, and (d) midrange for the given sample data.
An experiment was conducted to determine whether a deficiency of carbon dioxide in the soil affects the phenotype of peas. Listed below are the phenotype codes where 1= smooth-yellow, 2= smooth-green, 3= wrinkled-yellow, and 4=wrinkled-green. Do the results make sense?
1
3
3
1
2
3
1
1
3
2
1
2
(a) The mean phenotype code is-
(Round to the nearest tenth as needed.)
(b) The median phenotype code is
(Type an integer or a decimal.)
(c) Select the correct choice below and fill in any answer boxes within your choice.
O A. The mode phenotype code is
(Use a comma to separate answers as needed.)
O B. There is no mode.
(d) The midrange of the phenotype codes is
(Type an integer or a decimal.)
Do the measures of center make sense?
O A. All the measures of center make sense since the data is numerical.
O B. Only the mean, median, and midrange make sense since the data is nominal.
O C. Only the mode makes sense since the data is nominal.
O D. Only the mean, median, and mode make sense since the data is numerical.
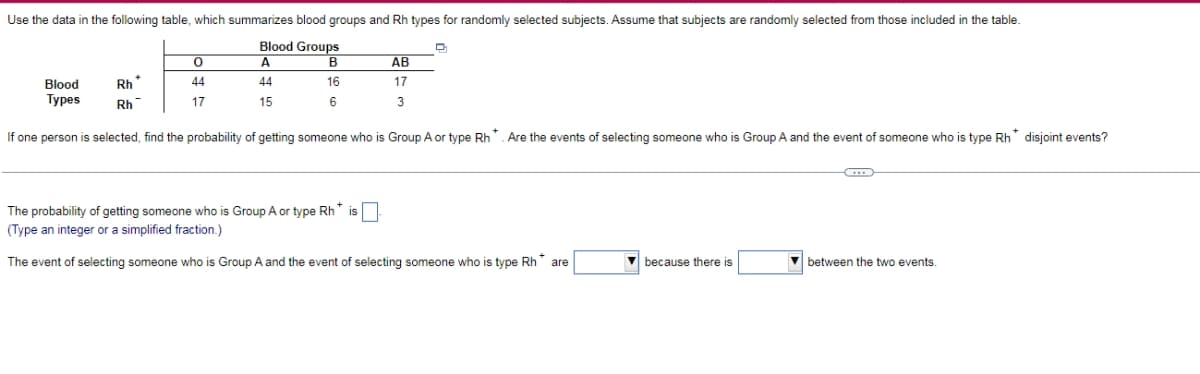
Transcribed Image Text:Use the data in the following table, which summarizes blood groups and Rh types for randomly selected subjects. Assume that subjects are randomly selected from those included in the table.
Blood Groups
В
АВ
Blood
Rh*
44
44
16
17
Турes
17
15
6
3
Rh
If one person is selected, find the probability of getting someone who is Group A or type Rh*. Are the events of selecting someone who is Group A and the event of someone who is type Rh* disjoint events?
The probability of getting someone who is Group A or type Rh*
(Type an integer or a simplified fraction.)
is
The event of selecting someone who is Group A and the event of selecting someone who is type Rh are
V because there is
V between the two events.
Expert Solution
This question has been solved!
Explore an expertly crafted, step-by-step solution for a thorough understanding of key concepts.

This is a popular solution!

Trending now
This is a popular solution!

Step by step
Solved in 2 steps with 1 images

Recommended textbooks for you
Glencoe Algebra 1, Student Edition, 9780079039897…
Algebra
ISBN:
9780079039897
Author:
Carter
Publisher:
McGraw Hill
Glencoe Algebra 1, Student Edition, 9780079039897…
Algebra
ISBN:
9780079039897
Author:
Carter
Publisher:
McGraw Hill