Find the correlation coefficient and report it accurate to three decimal places. What proportion of the variation in y can be explained by the variation in the values of x? Report answer as a percentage accurate to one decimal place. R² = % Check Answer
Find the correlation coefficient and report it accurate to three decimal places. What proportion of the variation in y can be explained by the variation in the values of x? Report answer as a percentage accurate to one decimal place. R² = % Check Answer

Glencoe Algebra 1, Student Edition, 9780079039897, 0079039898, 2018
18th Edition
ISBN:9780079039897
Author:Carter
Publisher:Carter
Chapter10: Statistics
Section10.3: Measures Of Spread
Problem 1GP

Related questions
Question
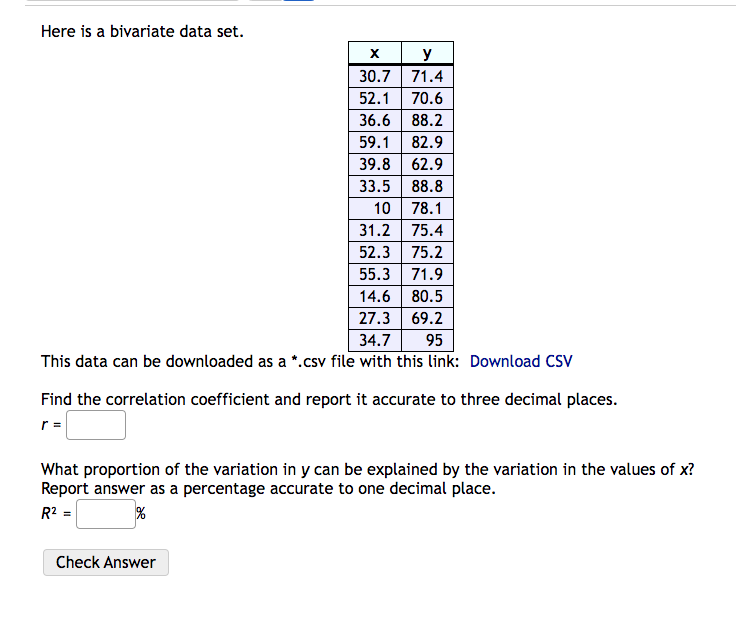
Transcribed Image Text:Here is a bivariate data set.
X
y
30.7
71.4
52.1
70.6
36.6
88.2
59.1
82.9
39.8 62.9
33.5 88.8
10
78.1
31.2
75.4
52.3
75.2
55.3 71.9
14.6 80.5
27.3 69.2
95
34.7
This data can be downloaded as a *.csv file with this link: Download CSV
Find the correlation coefficient and report it accurate to three decimal places.
r =
What proportion of the variation in y can be explained by the variation in the values of x?
Report answer as a percentage accurate to one decimal place.
R² =
%
Check Answer
Expert Solution
This question has been solved!
Explore an expertly crafted, step-by-step solution for a thorough understanding of key concepts.

This is a popular solution!

Trending now
This is a popular solution!

Step by step
Solved in 3 steps

Recommended textbooks for you
Glencoe Algebra 1, Student Edition, 9780079039897…
Algebra
ISBN:
9780079039897
Author:
Carter
Publisher:
McGraw Hill
Glencoe Algebra 1, Student Edition, 9780079039897…
Algebra
ISBN:
9780079039897
Author:
Carter
Publisher:
McGraw Hill