Find the corresponding x value, its standard uncertainty, w,, and the 95% confidence interval. Student's t values can be found in this table.
Find the corresponding x value, its standard uncertainty, w,, and the 95% confidence interval. Student's t values can be found in this table.

Linear Algebra: A Modern Introduction
4th Edition
ISBN:9781285463247
Author:David Poole
Publisher:David Poole
Chapter7: Distance And Approximation
Section7.3: Least Squares Approximation
Problem 34EQ

Related questions
Question
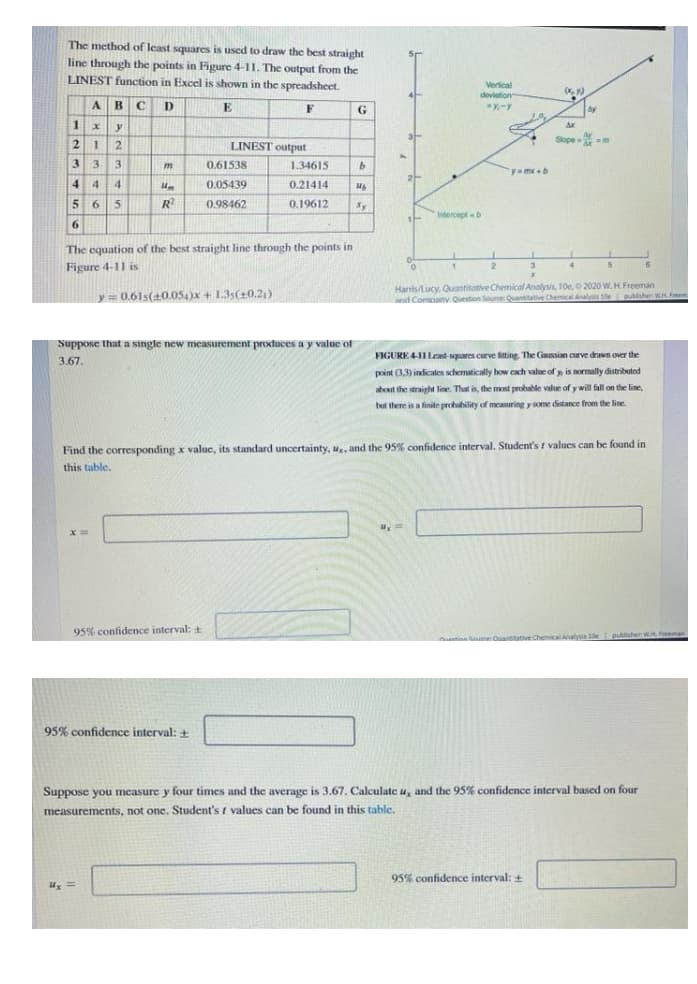
Transcribed Image Text:The method of least squares is used to draw the best straight
line through the points in Figure 4-11. The output from the
LINEST function in Excel is shown in the spreadsheet.
Verical
dovietion
4
B
D
E
F
G
Ay
2
LINEST output
Slope
e m
3
3
3.
0.61538
1.34615
yumx+b
4
4
0.05439
0.21414
5 6
R
0.98462
0.19612
Indercept b
6.
The equation of the best straight line through the points in
Figure 4-11 is
Harris/Lucy, Quantitative Chemical Analysis, 10e, 2020 W.H Freeman
nd Comoanv Question Source Quantitative Chenical Analsis 10e publsher WA eem
y 0.61s(40.054)x + 1.35(+0.21)
Suppose that a single new measurement produces a y value of
FIGURE 4-11 Least-spares curve fiting, The Gaussian curve drawn over the
3.67.
point 3,3) indicales schematically how cach value of , is normally distributed
about the straight line. That is, the most probable value of y will fall on the line,
but there is a finite probability of mcasuring y some distance from the line
Find the corresponding x valuc, its standard uncertainty, u, and the 95% confidence interval. Student's / values can be found in
this table.
95% confidence interval: +
publisher WM. Freeman
tinn me Ouantitative Chemical Aalysis 0e
95% confidence interval: +
Suppose you measure y four times and the average is 3.67. Calculate u, and the 95% confidence interval based on four
measurements, not one. Student's t values can be found in this table.
95% confidence interval: +
Expert Solution
This question has been solved!
Explore an expertly crafted, step-by-step solution for a thorough understanding of key concepts.

This is a popular solution!

Trending now
This is a popular solution!

Step by step
Solved in 3 steps

Recommended textbooks for you
Linear Algebra: A Modern Introduction
Algebra
ISBN:
9781285463247
Author:
David Poole
Publisher:
Cengage Learning

Elementary Linear Algebra (MindTap Course List)
Algebra
ISBN:
9781305658004
Author:
Ron Larson
Publisher:
Cengage Learning
Linear Algebra: A Modern Introduction
Algebra
ISBN:
9781285463247
Author:
David Poole
Publisher:
Cengage Learning
Elementary Linear Algebra (MindTap Course List)
Algebra
ISBN:
9781305658004
Author:
Ron Larson
Publisher:
Cengage Learning