Find the critical value to for the confidence level c = 0.95 and sample size n = 28. Click the icon to view the t-distribution table. 11 (Round to the nearest thousandth as needed.)
Find the critical value to for the confidence level c = 0.95 and sample size n = 28. Click the icon to view the t-distribution table. 11 (Round to the nearest thousandth as needed.)

Glencoe Algebra 1, Student Edition, 9780079039897, 0079039898, 2018
18th Edition
ISBN:9780079039897
Author:Carter
Publisher:Carter
Chapter10: Statistics
Section10.5: Comparing Sets Of Data
Problem 13PPS

Related questions
Question
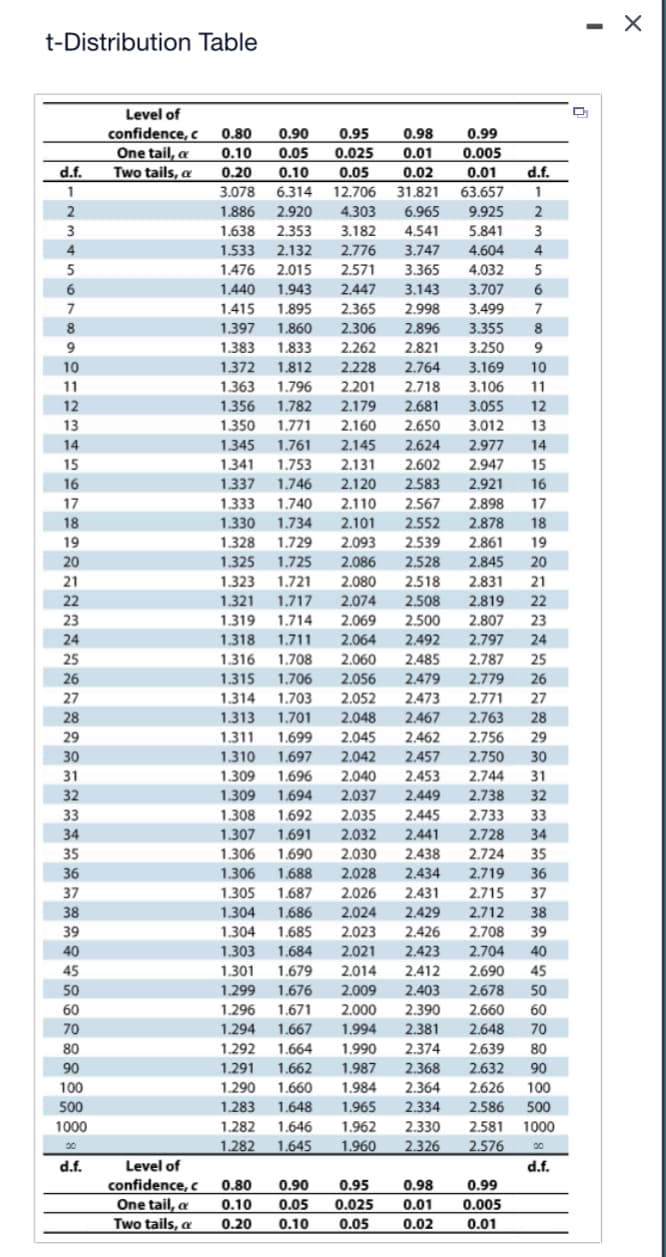
Transcribed Image Text:t-Distribution Table
d.f.
1
2
3
4
5
6
7
8
9
10
11
12
13
14
15
16
17
18
19
20
21
22
23
24
25
26
27
28
29
30
31
32
33
34
35
36
37
38
39
40
45
50
60
70
80
90
100
500
1000
00
d.f.
Level of
confidence, c 0.80
0.90 0.95
0.98
0.10
0.05
0.025
0.01
0.20
0.05
0.02
d.f.
63.657
1
0.10
3.078 6.314 12.706 31.821
1.886 2.920 4.303 6.965 9.925 2
1.638 2.353 3.182 4.541 5.841 3
1.533 2.132 2.776 3.747 4.604 4
1.476 2.015 2.571 3.365 4.032 5
1.440 1.943 2.447 3.143 3.707 6
1.415 1.895 2.365 2.998 3.499 7
1.397 1.860 2.306 2.896 3.355 8
1.383 1.833 2.262 2.821 3.250 9
3.169 10
3.106 11
1.372 1.812 2.228
1.363 1.796
2.764
2.201 2.718
2.681
1.356 1.782 2.179
1.350 1.771
2.160
2.650
3.055 12
3.012 13
2.977 14
2.947 15
1.345 1.761 2.145
2.624
1.341 1.753 2.131 2.602
1.337 1.746
2.583
2.921
16
2.120
2.110 2.567
1.333 1.740
2.898 17
1.330 1.734 2.101 2.552
2.878 18
1.328 1.729 2.093
2.539
2.861 19
1.325 1.725 2.086
2.528
2.845
20
2.518
2.831
21
2.508 2.819
22
One tail, a
Two tails, a
Level of
confidence, c
One tail, a
Two tails, a
0.99
0.005
0.01
0.80 0.90 0.95 0.98
0.10 0.05 0.025
0.20
0.10 0.05
2.807 23
2.797 24
25
1.323 1.721 2.080
1.321 1.717 2.074
1.319 1.714 2.069 2.500
1.318 1.711 2.064 2.492
1.316 1.708 2.060 2.485 2.787
1.315 1.706 2.056 2.479 2.779 26
1.314 1.703 2.052 2.473 2.771 27
1.313 1.701 2.048 2.467 2.763
1.311 1.699 2.045 2.462
1.310 1.697
1.309 1.696 2.040
1.309 1.694 2.037 2.449 2.738 32
1.308 1.692 2.035 2.445 2.733 33
1.307 1.691 2.032 2.441 2.728 34
1.306 1.690 2.030 2.438 2.724 35
1.306 1.688 2.028 2.434 2.719 36
1.305 1.687 2.026 2.431 2.715 37
1.304 1.686
2.429 2.712 38
2.756
2.042 2.457 2.750
30
2.453 2.744 31
2.024
1.304 1.685
2.023
2.426
2.708 39
1.303 1.684
2.021
2.423
2.704
40
1.301 1.679
2.014
2.412
2.690 45
1.299 1.676 2.009 2.403 2.678 50
1.296 1.671 2.000 2.390 2.660 60
1.294 1.667 1.994 2.381 2.648 70
1.292 1.664 1.990 2.374 2.639 80
1.291 1.662 1.987 2.368 2.632 90
1.290 1.660 1.984 2.364 2.626 100
1.283 1.648 1.965 2.334 2.586 500
1.282 1.646 1.962 2.330 2.581 1000
1.282 1.645
1.960
2.326
2.576 00
d.f.
0.99
0.01 0.005
0.02
0.01
-
28
29
-
X
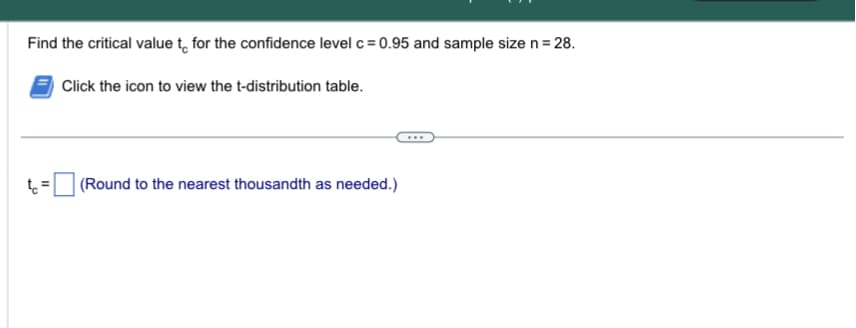
Transcribed Image Text:Find the critical value to for the confidence level c = 0.95 and sample size n = 28.
to
11
Click the icon to view the t-distribution table.
(Round to the nearest thousandth as needed.)
***
Expert Solution
This question has been solved!
Explore an expertly crafted, step-by-step solution for a thorough understanding of key concepts.

Step by step
Solved in 3 steps

Recommended textbooks for you
Glencoe Algebra 1, Student Edition, 9780079039897…
Algebra
ISBN:
9780079039897
Author:
Carter
Publisher:
McGraw Hill
Glencoe Algebra 1, Student Edition, 9780079039897…
Algebra
ISBN:
9780079039897
Author:
Carter
Publisher:
McGraw Hill