Find the equation of the regression line for the given data. Then construct a scatter plot of the data and drew the regression line. (Each pair of variables has a significant correlation.) Then use the regression equation to predict the value of y for each of the given x-values, i meaningful. The caloric content and the sodium content (in milligrams) for 6 beef hot dogs are shown in the table below. 120 130 Calories, x Sodium, y Find the regression equation. 180 480 (Round to three decimal places as needed.) Choose the correct graph below. OC. 523.875 OD. not meaningfu (a) pog 70 270 (a) Predict the value of y for x 170. Choose the correct answer below. OA 463.575 OB. 400.275 193 513 (a)x= 170 calories (c) x 140 calories OC. (uguns Calore (b)x=90 calories (0) x-200 calories D. Cari
Find the equation of the regression line for the given data. Then construct a scatter plot of the data and drew the regression line. (Each pair of variables has a significant correlation.) Then use the regression equation to predict the value of y for each of the given x-values, i meaningful. The caloric content and the sodium content (in milligrams) for 6 beef hot dogs are shown in the table below. 120 130 Calories, x Sodium, y Find the regression equation. 180 480 (Round to three decimal places as needed.) Choose the correct graph below. OC. 523.875 OD. not meaningfu (a) pog 70 270 (a) Predict the value of y for x 170. Choose the correct answer below. OA 463.575 OB. 400.275 193 513 (a)x= 170 calories (c) x 140 calories OC. (uguns Calore (b)x=90 calories (0) x-200 calories D. Cari

College Algebra
7th Edition
ISBN:9781305115545
Author:James Stewart, Lothar Redlin, Saleem Watson
Publisher:James Stewart, Lothar Redlin, Saleem Watson
Chapter1: Equations And Graphs
Section: Chapter Questions
Problem 6P

Related questions
Question
Transcribed Image Text:Question list
Question 35
Question 36
Question 37
Question 38
Question 39
Question 40
Question 41
Question 42
K
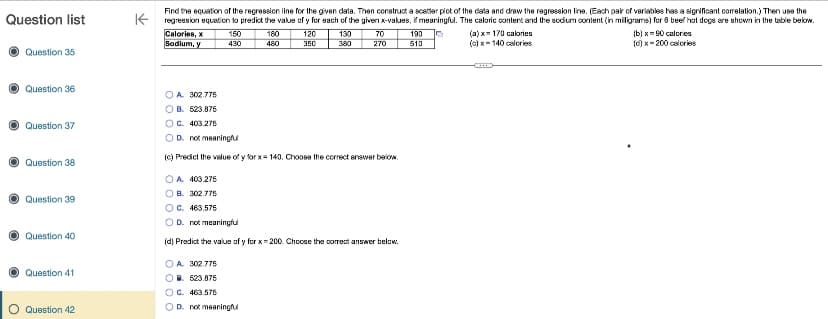
Find the equation of the regression line for the given data. Then construct a scatter plot of the data and draw the regression line. (Each pair of variables has a significant correlation.) Then use the
regression equation to predict the value of y for each of the given x-values, if meaningful. The caloric content and the sodium content (in milligrame) for 6 beef hot dogs are shown in the table below.
Calories, x
Sodium, y
150
430
180
480
120
350
O A 302.775
OB. 523.875
OC. 463.575
OD. not meaningfu
130
380
70
270
OA 302.775
OB. 523.875
OC. 403.275
OD. not meaningful
(c) Predict the value of y for x= 140. Choose the correct answer below.
OA 403.275
OB. 302.775
C. 463.575
O D. not meaningful
(d) Predict the value of y for x=200. Choose the correct answer below.
190 15
510
(a)x= 170 calories
(c)x= 140 calories
(b)x= 90 calories
(c) x 200 calories
Transcribed Image Text:Question list
Question 35
Question 36
Question 37
Question 38
Question 39
Question 40
Question 41
O Question 42
K
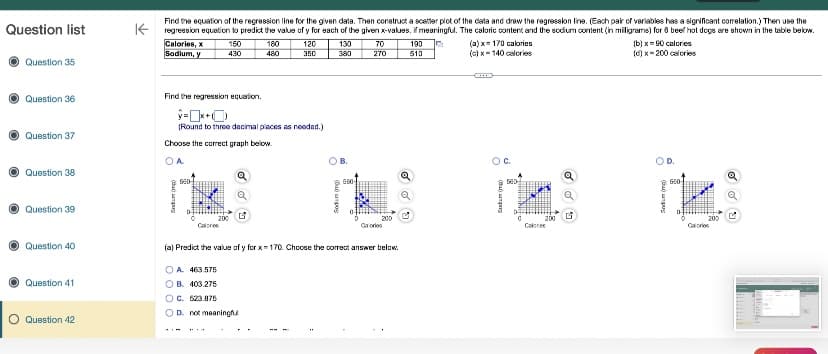
Find the equation of the regression line for the given data. Then construct a scatter plot of the data and draw the regression line. (Each pair of variables has a significant correlation.) Then use the
regression equation to predict the value of y for each of the given x-values, if meaningful. The caloric content and the sodium content (in milligrams) for 6 beef hot dogs are shown in the table below.
Calories, x
Sodium, y
Find the regression equation.
150
430
SED
Calories
(Round to three decimal places as needed.)
Choose the correct graph below.
OA
180
480
120
350
OA 463.575
OB. 403.275
OC. 523.975
OD. not meaningful
130
380
OB.
Sodium (mg)
650-
70
270
200
(a) Predict the value of y for x=170. Choose the correct answer below.
190
510
(a)x= 170 calories
(c) x 140 calories
C
(a) ampog
C.
SED
HEINE
Calor
200
d'a
(b)x=90 calories
(c) x 200 calories
D.
Sodium (mg)
650
200
Calories
Expert Solution
This question has been solved!
Explore an expertly crafted, step-by-step solution for a thorough understanding of key concepts.

This is a popular solution!

Trending now
This is a popular solution!

Step by step
Solved in 8 steps with 1 images

Recommended textbooks for you
College Algebra
Algebra
ISBN:
9781305115545
Author:
James Stewart, Lothar Redlin, Saleem Watson
Publisher:
Cengage Learning

Glencoe Algebra 1, Student Edition, 9780079039897…
Algebra
ISBN:
9780079039897
Author:
Carter
Publisher:
McGraw Hill

Algebra and Trigonometry (MindTap Course List)
Algebra
ISBN:
9781305071742
Author:
James Stewart, Lothar Redlin, Saleem Watson
Publisher:
Cengage Learning
College Algebra
Algebra
ISBN:
9781305115545
Author:
James Stewart, Lothar Redlin, Saleem Watson
Publisher:
Cengage Learning
Glencoe Algebra 1, Student Edition, 9780079039897…
Algebra
ISBN:
9780079039897
Author:
Carter
Publisher:
McGraw Hill
Algebra and Trigonometry (MindTap Course List)
Algebra
ISBN:
9781305071742
Author:
James Stewart, Lothar Redlin, Saleem Watson
Publisher:
Cengage Learning

Functions and Change: A Modeling Approach to Coll…
Algebra
ISBN:
9781337111348
Author:
Bruce Crauder, Benny Evans, Alan Noell
Publisher:
Cengage Learning
