FIND THE FF. 1. Q1 2. D5 3.P75


Q: article in Obesity Research (“Impaired Pressure Natriuresis in Obese Youths” (2003, Vol. 11, pp.…
A:
Q: Find the following z values for the standard normal variable Z. (You may find it useful to reference…
A: According to our policy we can answer only first three part for remaining please repost the…
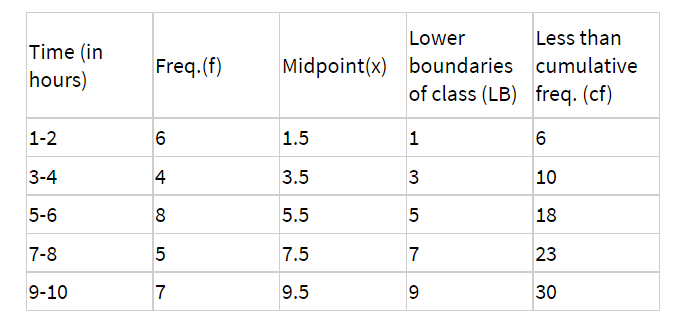
Q: 23 The data represent the time, in minutes, spent reading a political blog in a day. Construct a…
A: Given that
Q: Scenario: A mathematics placement test is given to all entering freshmen at a small college. A…
A: The objective is to plot a scatterplot and find the correlation coefficient for the following data:…
Q: hourly wages of wives are normally distributed with a mean of 8.71 and a standard deviation of 1.6,…
A:
Q: (a) Find the mean and variance of X. (b) Use Chebyshev's inequality to find a lower bound for P(300…
A:
Q: Public Policy Polling recently conducted a survey asking adults across the U.S. about music…
A:
Q: yrone is the manager of an independent gym that operates a embership scheme and runs a small number…
A: Solution
Q: In a sample of 250 people, 154 said that they watched educational television. Based on these sample…
A: The best point estimate of population proportion is sample proportion (p^) p^ = xn Margin of error…
Q: gs per case was found to be 10.8. What is being estimated? What is the point estimate? If the…
A: *Answer:
Q: Table below shows the monthly Sales of JBC Company for the year 2021 Month Sales(In Million…
A: The question is about time series analysis Given :
Q: The response rate of a survey is the proportion of all people who were selected but did not complete…
A: The given statement is The response rate of a survey is the proportion of all people who were…
Q: The yield of a chemical reaction is influenced by the temperature at which the reaction is run. A…
A: Regression equation has two regression coefficients, they are slope and intercept. Slope is the…
Q: General Direction: Perform each of the following steps. a. Find the Spearman rank correlation…
A: Since you have posted a question with multiple subparts, we will solve first three subparts for you.…
Q: An elevator has a placard stating that the maximum capacity is 1304 lb-8 passengers. So, 8 adult…
A: The following information has been given: The population mean is μ=173. The population standard…
Q: Given the following frequency poly 2234 20 16 14 12 10 S 2 0 3 Find the upper limit of the third…
A: Solution-: We want to find the upper limit of the third class?
Q: c) A strangely biased coin is tossed 3 times. Let X be the discrete random variable representing the…
A: The question is about discrete prob. distribution Given :
Q: An investigator is interested in the wages of married couples. She knows that the hourly wages of…
A: Solution
Q: Plot the following table data on a scatter plot. Show the plot and classify what type of…
A: Scatterplot: Scatter plots have been used to depict how much one change can affect someone else by…
Q: (a) P(Z ≤ 1.56) = [ −1.18) = 0 (c) P (0.90 < Z < 2.16) =
A:
Q: e. The probability that the jump's round off error is greater than 2.24 is P(x > 2.24) =
A:
Q: The forecast for 2019 by the logarithmic regression method is 88.4411 81.5334 86.3938 84.9817…
A: Solution: Let X be the Year and Y be the sales. From the given information,
Q: What is the value of C? Complete the table. Class Frequency Lower Boundary (LB) Interval (1) 70-76…
A: Class Frequency (f) Lower boundary(LB) (class mark) (x) f⋅x <cf 70-76 15…
Q: The data found below measure the amounts of greenhouse gas emissions from three types of vehicles.…
A:
Q: Calculate the distance between the two variables given below using the most common method of…
A: Given,
Q: Formulate the equation of the regression line to predict the course grades given the placement…
A: Given information: Placement…
Q: For the scatterplot shown below, what can you say about the correlation? 800 700 600 500 400 300 200…
A: Given: The scatterplot is given and we need to say about its correlation.
Q: Of the data sets below, which has standard deviation 0? Set A: 1, 2, 3, 4 Set B: 1, 1,4,7 Set C: 0,…
A: The Data set D. 6,6,6,6 Σx=24 Σx2=62+62+62+62=144n=4The standard deviation is…
Q: The health of employees is monitored by periodically weighing them in. A sample of n = 54 employees…
A:
Q: Heights of WOMEN in the U.S. are normally distributed. Recent information shows: Adult women…
A: Given:
Q: In what class interval can we find the mode? Complete the table. Class Interval Frequency (1) Lower…
A: To find: In what class interval can we fi drhe mode.
Q: Problem 2: A political rally contains 20 Republicans, 13 Democrats and 6 Independents. 1. If one…
A:
Q: Teacher Rowelin wants to estimate the average time of her students spend in TikTok and wants to…
A: Given that n =25 ,alpha = 0.01 ,mean =6,s.d =2
Q: Suppose 3% of items manufactured at a facility are defective. A random sample of 600 items are…
A:
Q: 2. A Municipal Health Officer (MHO) who actively supports the CDD Programme of the government…
A: Given Data : Sample Size, n = 100 Sample Mean, x̄ = 86.1 standard…
Q: The additional growth of plants in one week are recorded for 6 plants with a sample standard…
A:
Q: dependent observations X₁, X2 and X3 come from normal stributions that have the same mean, μ, but…
A: Solution
Q: The following histogram shows the scores on the first statistics exam. 21 i How many students took…
A:
Q: Let X represent a binomial random variable with n = 200 and p = 0.77. Find the following…
A: Note: As per guidelines we are supposed to solve only first three sub parts. Kindly repost the other…
Q: (a) State the null hypothesis Ho and the alternative hypothesis H₁. Ho :O H₁:0 (b) Determine the…
A: The provided information is x¯=32s=7n=21α=0.05The degrees od freedom is df=n-1=21-1=20
Q: Formulate the equation of the regression line to predict the course grades given the placement…
A: Given information: No. of observations=20No. of variables=2Variables=1. Placement Test2. Course…
Q: Investing in the stock market can offer plenty of benefits and involve some risks. If an investor…
A: Given P loss/participates in the stock market=0.13 Pgain/does not participates in the stock market…
Q: Po (1-Po) Evaluate the formula SE = n SE= (Round to three decimal places as needed.) when Po = 0.69…
A:
Q: Scenario: A mathematics placement test is given to all entering freshmen at a small college. A…
A: A mathematics placement test is given to all entering freshmen at a small college.
Q: A football coach randomly selected eight players and timed how long it took to perform a certain…
A:
Q: correlated variables X and Y is 96. EXAMPLE 13. The covariance of two perfectly Determine o, and o,…
A: HERE Given COV (X,Y) = 96 and For Perfectly correlated variables X and Y correlation=1 THE sign…
Q: For numbers 6 to 10, refer to the table below. A group of Grade 10 students were asked to write down…
A: From the frequency table We have to cclaculate Class interval, class lower boundary for Q3 D4 class…
Q: Practice question 1 The price of the 25 # ordinary shares of Manco plc quoted on the Stock Exchange…
A: Given data
Q: n a survey, 23 people were asked how much they spent on their child's last birthday gift. The…
A: The following information has been given: The sample size is n=23. The sample mean is x¯=31. The…
Q: 6. A random sample of size 30 taken from a population of 1000 with =20 and ²=9.
A: According to our policy we can answer only first part for remaining please repost the question.
FIND THE FF.
1. Q1
2. D5
3.P75

Step by step
Solved in 2 steps

- Population Genetics-First Cousins This is a continuation of Exercise 5. Double first cousins are first cousins in two waysthat is, each of the parents of one is a sibling of a parent of the other. First cousins in general have six different grandparents whereas double first cousins have only four different grandparents. For mating between double first cousins, the proportions of the genotypes of the children can be accounted for in terms of those of parents, grandparents, and great-grandparent: 3=122+14+18. a. Find all solutions to the cubic equation above and Identify which is 1. b. After 5 generations, what proportion of the population will be homozygous? c. After 20 generations, what proportion of the population will be homozygous? 5. Population Genetics In the study of population genetics, an important measure of inbreeding is the proportion of homozygous genotypesthat is, instances in which the two alleles carried at a particular site on an individuals chromosomes are both the same. For population in which blood-related individual mate, them is a higher than expected frequency of homozygous individuals. Examples of such populations include endangered or rare species, selectively bred breeds, and isolated populations. in general. the frequency of homozygous children from mating of blood-related parents is greater than that for children from unrelated parents Measured over a large number of generations, the proportion of heterozygous genotypesthat is, nonhomozygous genotypeschanges by a constant factor 1 from generation to generation. The factor 1 is a number between 0 and 1. If 1=0.75, for example then the proportion of heterozygous individuals in the population decreases by 25 in each generation In this case, after 10 generations, the proportion of heterozygous individuals in the population decreases by 94.37, since 0.7510=0.0563, or 5.63. In other words, 94.37 of the population is homozygous. For specific types of matings, the proportion of heterozygous genotypes can be related to that of previous generations and is found from an equation. For mating between siblings 1 can be determined as the largest value of for which 2=12+14. This equation comes from carefully accounting for the genotypes for the present generation the 2 term in terms of those previous two generations represented by for the parents generation and by the constant term of the grandparents generation. a Find both solutions to the quadratic equation above and identify which is 1 use a horizontal span of 1 to 1 in this exercise and the following exercise. b After 5 generations, what proportion of the population will be homozygous? c After 20 generations, what proportion of the population will be homozygous?Find the class boundaries. Class limits Class boundaries 0.5 - 11.4 - 11.5 - 22.4 - 22.5 - 33.4 - 33.5 - 44.4 - 44.5 - 55.4 -Limits. Calculus III
- Through partitions proofEngineering Data Analysis From a box containing 4 defective and 5 non-defective items, how manysamples of size 3 are possible.a. With no restrictionsb. With 1 defective and 2 non-defective itemsc. With 2 defectives and 1 non-defective item if a certain item must be onthe samples chosen Please put formulaShow full solution. To inspect the quality of the screens for mobile phones produced by Company X, two separate inspection devices are used to test the screens for defects. Basically, a specific screen is tested once using the two inspection devices. Device 1 can detect the presence of defects 99.3% of the time, whereas Device 2 can detect defects 99.7% of the time. Assume that the 2 devices are operating independently from each other. One day, four defective screens were sent for inspection. Let X represent the number of screens that will be correctly tagged as defective by Device 1, while Y represents the number of screens that will be correctly tagged as defective by Device 2. Determine the following:a.) fXY(x,y)b.) fX (x)c.) E(X)
- Show full solution. To inspect the quality of the screens for mobile phones produced by Company X, two separate inspection devices are used to test the screens for defects. Basically, a specific screen is tested once using the two inspection devices. Device 1 can detect the presence of defects 99.3% of the time, whereas Device 2 can detect defects 99.7% of the time. Assume that the 2 devices are operating independently from each other. One day, four defective screens were sent for inspection. Let X represent the number of screens that will be correctly tagged as defective by Device 1, while Y represents the number of screens that will be correctly tagged as defective by Device 2. Determine the following:a.) fY|2b.) E(Y|X=2)c.) V(Y|X=2)d.) Are X and Y independent? ExplainLimits. Calculus III. show all work neatly! Thank you19. Linear Combination Consistency
- Limits! Calculus III. SHOW ALL WORK NEATLY PLEASE AND THANK YOUA specific car’s fuel economy in miles per gallon can be approximated by f(x) = 0.00000056x4 – 0.000018x3 +1.38x- 0.38, where x represents the car’s speed in miles per hour. Determine the fuel economy when the car is traveling 40, 50, and 60 miles per hour. Process Questions: What is f(40)?, f(50)?, and f(60)? Which car speed maximizes fuel consumption? Can you suggest some ways or tips on how to save fuel? What do you think is the best way to save fuel? Why? How did the modelling process help you answer the different problems? How do values of one variable behave in terms of the other in the polynomial function that models a real- world situation?Downvoting if all parts aren't answred


