) Find the highest and lowest temperatures recorded. (b) Use these two numbers to find the amplitude. (c) Find the period of the function. (d) What is the trend of the temperature now? (Downward, upward, etc.)
) Find the highest and lowest temperatures recorded. (b) Use these two numbers to find the amplitude. (c) Find the period of the function. (d) What is the trend of the temperature now? (Downward, upward, etc.)

Algebra & Trigonometry with Analytic Geometry
13th Edition
ISBN:9781133382119
Author:Swokowski
Publisher:Swokowski
Chapter4: Polynomial And Rational Functions
Section4.3: Zeros Of Polynomials
Problem 64E

Related questions
Question
100%
(a) Find the highest and lowest temperatures recorded.
(b) Use these two numbers to find the amplitude.
(c) Find the period of the
(d) What is the trend of the temperature now? (Downward, upward, etc.)
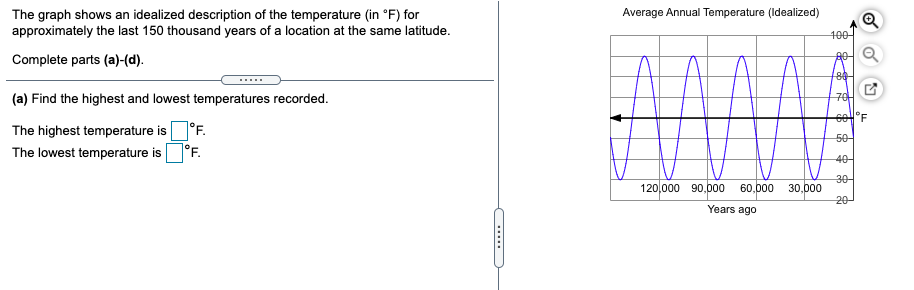
Transcribed Image Text:Average Annual Temperature (Idealized)
The graph shows an idealized description of the temperature (in °F) for
approximately the last 150 thousand years of a location at the same latitude.
100
Complete parts (a)-(d).
.....
(a) Find the highest and lowest temperatures recorded.
구매
The highest temperature is°F.
The lowest temperature is°F.
50
40-
120,000 90,0poo
60,000
30
30,000
20-
Years ago
.....
Expert Solution
This question has been solved!
Explore an expertly crafted, step-by-step solution for a thorough understanding of key concepts.

This is a popular solution!

Trending now
This is a popular solution!

Step by step
Solved in 2 steps with 1 images

Recommended textbooks for you
Algebra & Trigonometry with Analytic Geometry
Algebra
ISBN:
9781133382119
Author:
Swokowski
Publisher:
Cengage

College Algebra (MindTap Course List)
Algebra
ISBN:
9781305652231
Author:
R. David Gustafson, Jeff Hughes
Publisher:
Cengage Learning

Glencoe Algebra 1, Student Edition, 9780079039897…
Algebra
ISBN:
9780079039897
Author:
Carter
Publisher:
McGraw Hill
Algebra & Trigonometry with Analytic Geometry
Algebra
ISBN:
9781133382119
Author:
Swokowski
Publisher:
Cengage
College Algebra (MindTap Course List)
Algebra
ISBN:
9781305652231
Author:
R. David Gustafson, Jeff Hughes
Publisher:
Cengage Learning
Glencoe Algebra 1, Student Edition, 9780079039897…
Algebra
ISBN:
9780079039897
Author:
Carter
Publisher:
McGraw Hill