Find the indicated probability. 390 voters are classified by income and political party. The results are shown in the table. If a person is selected at random from the sample, find the probability that the person has high income. Democrat Republican Total 176 Low Income 108 68 Medium Income 85 70 155 HighIncome Super High Income Total 21 19 40 11 19 225 165 390 Solution: P=40/390= 0.1026 O 0.054 0.525 O 0.093 0.103
Find the indicated probability. 390 voters are classified by income and political party. The results are shown in the table. If a person is selected at random from the sample, find the probability that the person has high income. Democrat Republican Total 176 Low Income 108 68 Medium Income 85 70 155 HighIncome Super High Income Total 21 19 40 11 19 225 165 390 Solution: P=40/390= 0.1026 O 0.054 0.525 O 0.093 0.103

Chapter8: Sequences, Series,and Probability
Section: Chapter Questions
Problem 93RE

Related questions

Question
Transcribed Image Text:O Right skewed
O Left skewed
O Reverse J-shaped
QUESTION 2
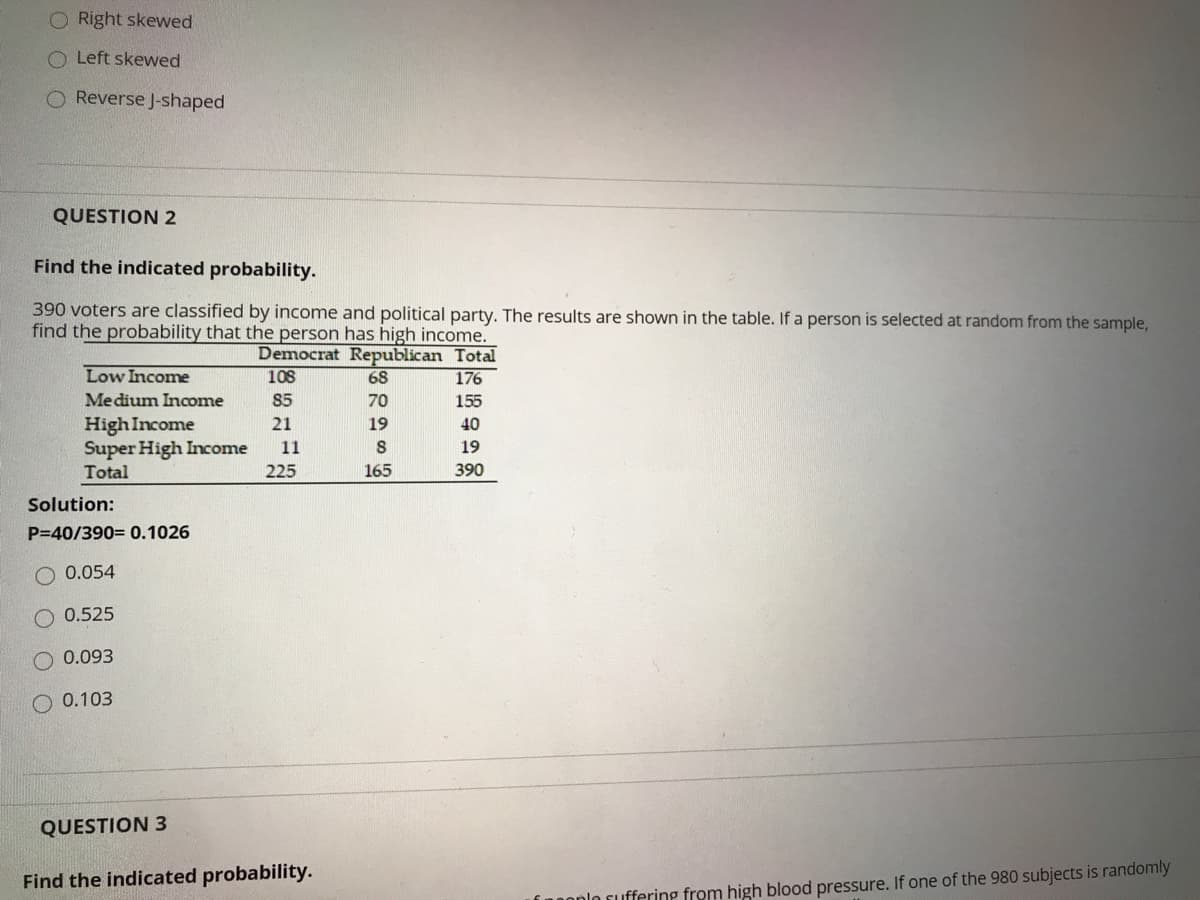
Find the indicated probability.
390 voters are classified by income and political party. The results are shown in the table. If a person is selected at random from the sample,
find the probability that the person has high income.
Democrat Republican Total
Low Income
108
68
176
Medium Income
85
70
155
HighIncome
Super High Income
Total
21
19
40
11
19
225
165
390
Solution:
P=40/390= 0.1026
O 0.054
0.525
0.093
O 0.103
QUESTION 3
Find the indicated probability.
LOonlo suffering from high blood pressure. If one of the 980 subjects is randomly
Expert Solution
Step 1


Trending now
This is a popular solution!

Step by step
Solved in 2 steps with 2 images

Knowledge Booster


Learn more about
Need a deep-dive on the concept behind this application? Look no further. Learn more about this topic, statistics and related others by exploring similar questions and additional content below.Recommended textbooks for you

Algebra and Trigonometry (MindTap Course List)
Algebra
ISBN:
9781305071742
Author:
James Stewart, Lothar Redlin, Saleem Watson
Publisher:
Cengage Learning

College Algebra
Algebra
ISBN:
9781305115545
Author:
James Stewart, Lothar Redlin, Saleem Watson
Publisher:
Cengage Learning
Algebra and Trigonometry (MindTap Course List)
Algebra
ISBN:
9781305071742
Author:
James Stewart, Lothar Redlin, Saleem Watson
Publisher:
Cengage Learning
College Algebra
Algebra
ISBN:
9781305115545
Author:
James Stewart, Lothar Redlin, Saleem Watson
Publisher:
Cengage Learning

Holt Mcdougal Larson Pre-algebra: Student Edition…
Algebra
ISBN:
9780547587776
Author:
HOLT MCDOUGAL
Publisher:
HOLT MCDOUGAL