Find the interquartile range and quartile deviation for the data in (a) Table 2.29 and (b) Table 2.30. Ans. (a) IR $0.10 and QD ≈ $0.05 (b) IR ≈ $476 and QD ≈ $238
Find the interquartile range and quartile deviation for the data in (a) Table 2.29 and (b) Table 2.30. Ans. (a) IR $0.10 and QD ≈ $0.05 (b) IR ≈ $476 and QD ≈ $238

Glencoe Algebra 1, Student Edition, 9780079039897, 0079039898, 2018
18th Edition
ISBN:9780079039897
Author:Carter
Publisher:Carter
Chapter4: Equations Of Linear Functions
Section4.5: Correlation And Causation
Problem 23PFA

Related questions
Question
Please solve and show complete solution. Thank you!
![CHAP. 2]
MEASURES OF DISPERSION
2.38
DESCRIPTIVE STATISTICS
35
Find the interquartile range and quartile deviation for the data in (a) Table 2.29 and (b) Table 2.30.
Ans. (a) IR $0.10 and QD ≈ $0.05 (b) IR≈ $476 and QD ≈ $238](/v2/_next/image?url=https%3A%2F%2Fcontent.bartleby.com%2Fqna-images%2Fquestion%2F9fd6c43e-892d-47b2-b75b-7e2b99a206cb%2F51a8a919-5086-4cfc-9033-187f515f965f%2Fy7esmo6_processed.jpeg&w=3840&q=75)
Transcribed Image Text:CHAP. 2]
MEASURES OF DISPERSION
2.38
DESCRIPTIVE STATISTICS
35
Find the interquartile range and quartile deviation for the data in (a) Table 2.29 and (b) Table 2.30.
Ans. (a) IR $0.10 and QD ≈ $0.05 (b) IR≈ $476 and QD ≈ $238
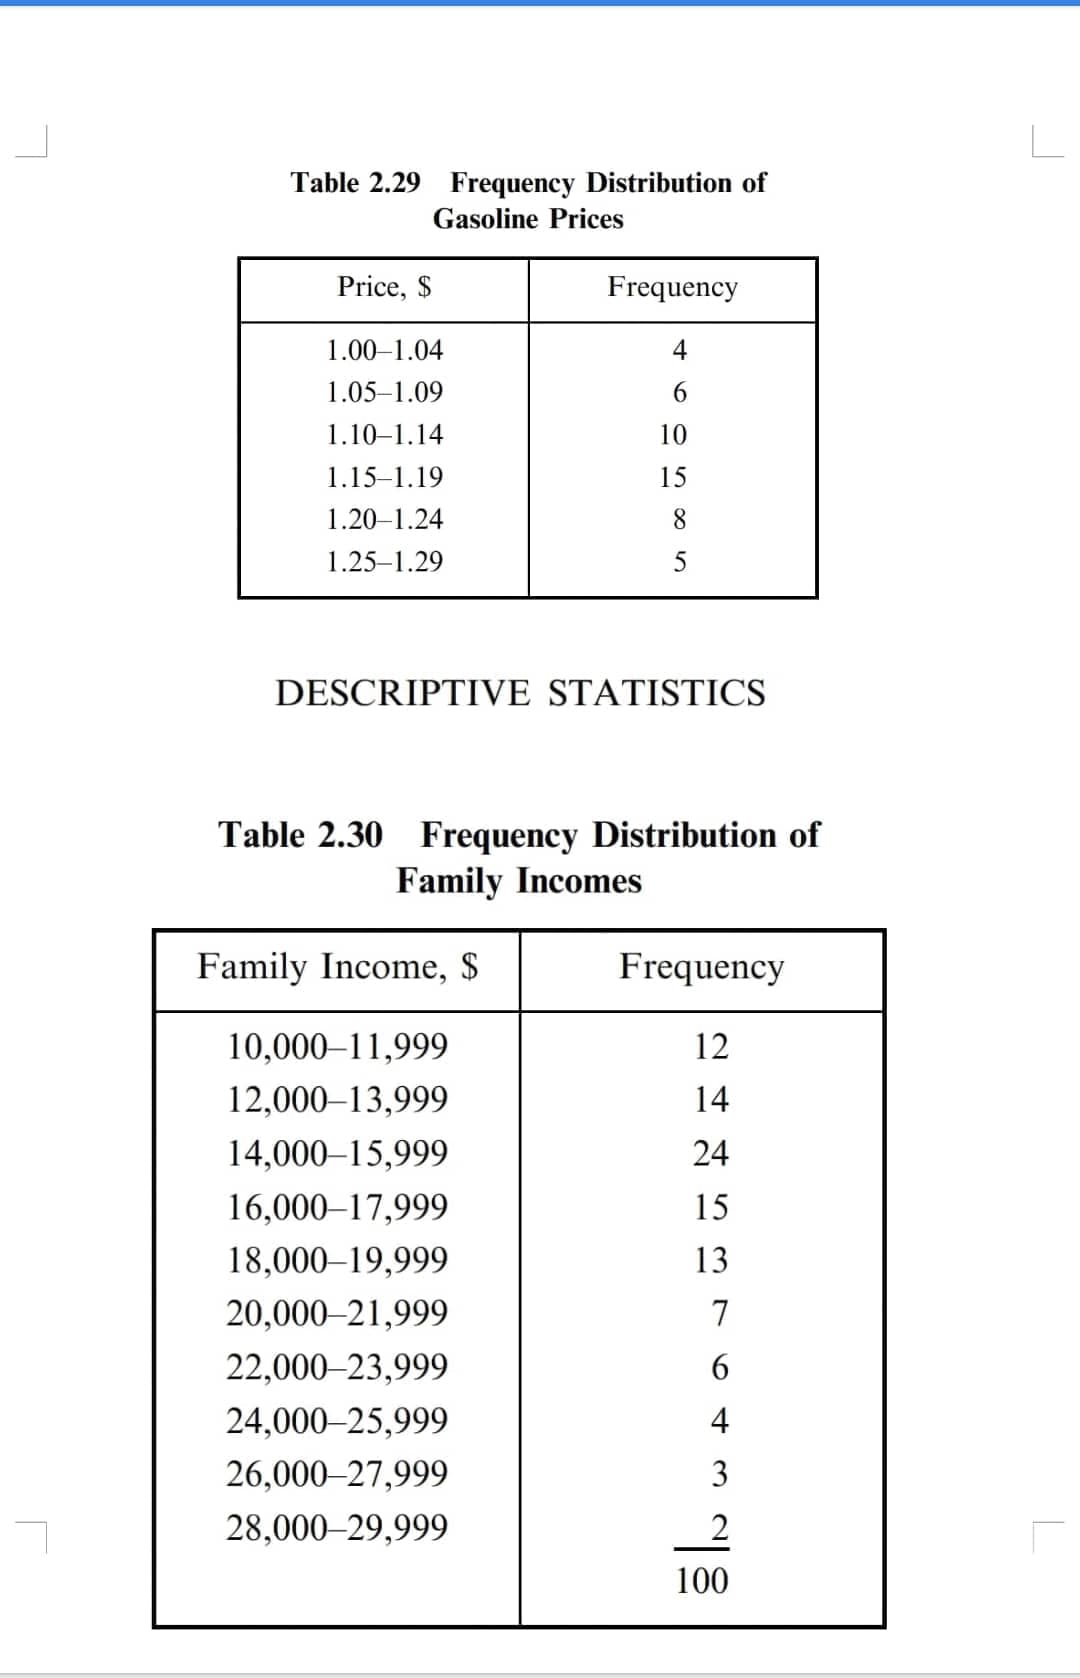
Transcribed Image Text:Table 2.29 Frequency Distribution of
Gasoline Prices
Price, $
1.00-1.04
1.05-1.09
1.10-1.14
1.15-1.19
1.20-1.24
1.25-1.29
Frequency
4
6
DESCRIPTIVE STATISTICS
10,000-11,999
12,000-13,999
14,000-15,999
16,000-17,999
18,000-19,999
20,000-21,999
10
15
8
5
Table 2.30 Frequency Distribution of
Family Incomes
Family Income, $
22,000-23,999
24,000-25,999
26,000-27,999
28,000-29,999
Frequency
12
14
24
15
13
7
6
4
3
2
100
Expert Solution
This question has been solved!
Explore an expertly crafted, step-by-step solution for a thorough understanding of key concepts.

Step by step
Solved in 3 steps

Recommended textbooks for you
Glencoe Algebra 1, Student Edition, 9780079039897…
Algebra
ISBN:
9780079039897
Author:
Carter
Publisher:
McGraw Hill
Glencoe Algebra 1, Student Edition, 9780079039897…
Algebra
ISBN:
9780079039897
Author:
Carter
Publisher:
McGraw Hill