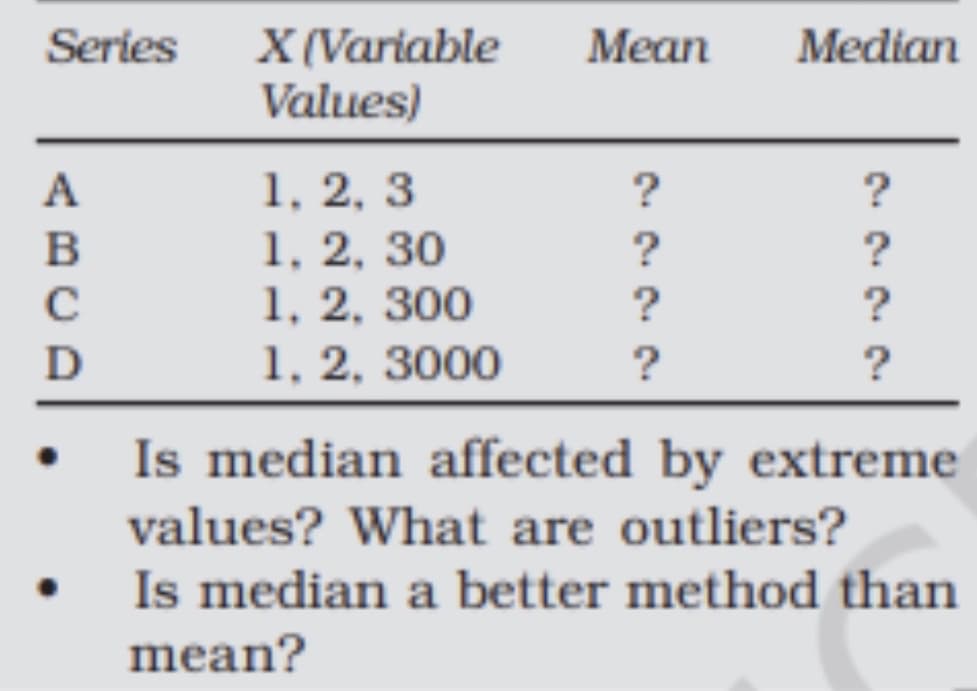
Find the mean and median and outliers.


Q: Find the median of 19, 29, 36, 15, and 20.
A: Sort the given data in ascending order. 15,19,20.,29,36
Q: Find the mean and median
A: Note: Here we are solving problem 12) with the parts a), b), and c) For the reaming problem please…
Q: a. The mean is The median is
A: mean= sum of all observation/number of observations. mode =most occurring value in the data set.…
Q: find the mean of 2,4,6,8 and 10
A: Given data is 2,4,6,8 and 10sample size(n)=5
Q: A basketball measured the heights of his players and found them to be: 173cm, 177 cm, 185cm, 183cm,…
A:
Q: Use the display of data to find the mean, median, mode, and midrange. (Round to the nearest tenth as…
A:
Q: . Find the mean of the active cases of the fifteen barangays in San Mateo. . Find the median of the…
A: 1). Mean is defined as the average of the data set. The formula is: Mean=Sum of all…
Q: Find the mean,median and mode
A: Arrange the data in ascending order. S.no. # of Alligatores 1 43 2 51 3 64 4 64 5 76…
Q: Find the (a) mean, (b) median, (c) mode, and (c
A: Given that The data are…
Q: find the mean of the number of spots that appear when a die is tossed
A: It is asked to find the mean of the number of spots that appear when a die is tossed. Explanation :…
Q: Find the range , the standard deviation, the variance for 45, 75, 84, 58, 81, 65 , 98,63,76
A: Range = Maximum - Minimum = 98 - 45 = 53 The standard deviation can be determined using the…
Q: Each of 8 students reported the number of movies they saw in the past year. This is what they…
A: Movie sawn by 8 students in the past year are 10, 16, 16, 16, 18, 20, 9, 8 To find the mean and…
Q: On a typical box plot, what does the vertical line in the middle of the box represent? A.) the…
A: The vertical line in the middle of the box represents the middle value of the data, which is the…
Q: Find the variance of the number of storms in August.
A: X: Number of thunderstorms in August.
Q: State whether the mean, median, or mode is being used in the given statement. The average score of…
A: Mean is the average of all items. Mode is most frequently occurring item. Median is the middle most…
Q: What is the center of {0.1, 0.3, 0.02, 0.09, 0.4, 0.05, 0.26}? [ Select ] A. What is the mean of the…
A: Dear student since the policy is to answer first 3 subparts so kindly repost the other.
Q: Find the mean, the median and the mode of the heights.
A: Mean is defined as the sum of observations divided by number of observation. Median is the middle…
Q: r the data represented by the Stem and Leaf diagram shown below find The Mode and The Median
A: The stem and leaf plot given is as follows
Q: Find the mean of the data set: 14, 19, 13, 22, 7
A: Given data is : 14, 19, 13, 22, 7 Number of terms is n=5 To find the mean.
Q: Find the mean and median for the grouped data.
A: The mean and median are the types of average. Mean is the mathematical average and median is the…
Q: A high school has 28 players on the football team. The summary of player's weights is given in the…
A: Here we have to find median from the given box plot
Q: A data set {19, 5х, 14, 8, Зх, 29} has a mean of 25. Find the median of the data
A: Find the median of the data set.
Q: Find the median marks.
A: Since , the frequency distribution of marks is given. Our aim is to find the median marks.
Q: What happens to the median and mean
A: We have to find the mean and median
Q: Find the mean for the following set of scores: 2,7,9,4,5,3,0,6
A: Given that, The data set is 2,7,9,4,5,3,0,6
Q: Find the mode, median, and mean of the scores. (If there is no mode, enter NON 6.05, 5.01, 5.14,…
A:
Q: FInd the Mean and Median of Both Boys and Girls
A: Given data,For boys:10,7,8,11For girls:6,9,8,5
Q: Given the data set 8, 10, 9,5, 10, 7, 19, 10. Find the median of the given data set. Answer:
A: Use definition of Median to calculate the median of the given data.
Q: How to find the Mean, Median, and Mode for this specific table? Table is Ordinal.
A: For ordinal data mean cannot be found as it require an arithmetic operation like addition and…
Q: Find the mean and median to revenue
A: These mean and median are summary statistics
Q: percentages:
A:
Q: Find the mean and median (in that order) for the data set: 2,5,2,8,3, a. 2,4 b. 4,2 c 3,4 d 4,3
A:
Q: Find the mean, median, mode of the scores of 40 students in a 50 item test. Complete the table
A: Complete table :- CLASS INTERVAL MIDPOINT(XI) FREQUENCY (fi) fixi cumfi(F) 15-19 17 3 51 3…
Q: Find the weighted mean of four test results, 65, 89, 105 and 101, where the first test counts 22%,…
A: Given: x weight 65 22% 89 32% 105 17% 101 29%
Q: A local travel office has 10 employees. Their monthly salaries are given below. $1520, $1730, $1690,…
A:
Q: For the frequency distribution table below, find the median *
A: Median is the middle most value of arranged data. For frequency distribution the median is defined…
Q: Find the mean, median and mode
A: To compute mean, median and mode for the given frequency distribution the calculations are given in…
Q: Find n. What is the value of the mean?
A: HERE GIVEN , SCORE FOR 400 FRESHMEN STUDENTS IN AN ENTRANCE EXAM here use grouped frequency formula…
Q: Find the mean, median, mode, and midrange for the data. Comment
A: Here given data of earnings of nonliving celebrities
Q: Find the median value
A: Given information: The probability density function of a random variable X is as given below:
Q: Find the median of the data in the box plot below. pencils Number of pencils in each student's desk…
A: Given
Q: The number of text messages that Isaac received each day for a week is shown: 47, 49, 54, 50, 48,…
A: See the attachment
Q: The median is closest to:
A: The discount rate set by bank for past 6 quarters are: Quarter Discount Rate 1 10.0%…
Q: Identify the line most likely to graphically represent the mean, median and mode of the…
A: The distribution of the graph seems to be negatively skewed as it has long tail on the left hand…
Q: For the stem and leaf plot, find the mean, median, and mode.
A:
Q: g. Find the 68th percentile.
A:
Q: Find the mean, median, and mode of the data set. 9, 6, 8, 6, 7
A: Arranging the data in ascending order 6, 6, 7, 8, 9 n=5 ∑x=6+6+7+8+9=36
Q: 20 2 24 2 28 4 32 36 10
A: The given frequency distribution table is, The value of cf is calculated as,
Q: Use the display of data items to find the mean, median, mode, and midrange.
A:

Step by step
Solved in 3 steps with 3 images

- Use the following scenario for the exercises that follow: In the game of Keno, a player starts by selecting 20 numbers from the numbers 1 to 80. After the player makes his selections, 20 winning numbers are randomly selected from numbers 1 to 80. A win occurs if the player has correctly selected 3,4, or 5 of the 20 winning numbers. (Round all answers to the nearest hundredth of a percent.) 55. How much less is a player’s chance of selecting 3 winning numbers than the chance of selecting either 4 or 5 winning numbers?Joaquin gets paid every Friday. FI is paychecks for the past 8 Fridays were $315, $236.25, $236.25, $236.25, $315, $315, $236.25, $393.75. Find the (a) mean, (b) median, and (c) mode.Use the following scenario for the exercises that follow: In the game of Keno, a player starts by selecting 20 numbers from the numbers 1 to 80. After the player makes his selections, 20 winning numbers are randomly selected from numbers 1 to 80. A win occurs if the player has correctly selected 3,4, or 5 of the 20 winning numbers. (Round all answers to the nearest hundredth of a percent.) 51. What is the percent chance that a player selects exactly 3 winning numbers?
- Use the following scenario for the exercises that follow: In the game of Keno, a player starts by selecting 20 numbers from the numbers 1 to 80. After the player makes his selections, 20 winning numbers are randomly selected from numbers 1 to 80. A win occurs if the player has correctly selected 3,4, or 5 of the 20 winning numbers. (Round all answers to the nearest hundredth of a percent.) 54. What is the percent chance of winning?Use the following scenario for the exercises that follow: In the game of Keno, a player starts by selecting 20 numbers from the numbers 1 to 80. After the player makes his selections, 20 winning numbers are randomly selected from numbers 1 to 80. A win occurs if the player has correctly selected 3,4, or 5 of the 20 winning numbers. (Round all answers to the nearest hundredth of a percent.) 53. What is the percent chance that a player selects all 5 winning numbers?Missing some outliers still
- X ~ N(–5, 2) What is the median?Millman’s golfing group is terrific for a group of amateurs. Are they ready to turn pro? (Remember a lower score in golf is better!) Size Average score SD Millman's Group 9 82 2.6 The Pros 500 71 3.1 what is the score and are they ready to turn pro?Heights of NBA All-Star players are normally distributed. 97.5% of players have a height of 85 inches or less, while 2.5% of players have a height of 71 inches or less. What is the z-score for a height of 76 inches?
- Q3) In a small village the sample of ages of 8 persons are given below as 26, 21, 8, 20, 16, 3, 22, 28 Find the co-efficient of variation from the above sample. Also find the z-score and percentile rank for 21. What would be the Q2 in this case.Walgreens purchased several new processing machines. The production department needed some guidance with respect to qualification needed by an operator. Is age a factor? Is the lenght of service as an operator (in years) important? In order to explore further, the factors needed to estimate performance on the new processing machines, 4 variables were listed; X1 - Length of time an employee was in the industry X2 - Mechanical aptitude test score X3 - Prior on the job rating X4 - Age Performance on the new machine is designated as y 30 employees were selected at random. Data were collected for each, and their performances on the new machines were recorded. A few results are; Name Performance on new machine (y) Length of time in industry (X1) Mechanical aptitude score (X2) Prior on the job performance (X3) Age (X4) Bill 112 6 310 115 49 Brenda 120 3 320 117 28 The equation is attached; As age increases by one year, how much does estimated performance on the new…The boxplots below represent movie run-times (length of a movie in minutes) for movies that have been rated by the Motion Picture Associate of America as R, PG-13, PG, and G. Which movies have the largest variety in typical run-time? Group of answer choices PG-13 because it has the largest IQR. PG-13 because it has the widest whiskers. R because it has the most outliers. It’s a tie between R and PG movies because they had the same median.


