Find the mean of the data summarized in the given frequency distribution. Compare the computed mean to the actual mean of 56.4 degrees. Low Temperature (o F) 40-44 •45-49 50-54 55-59 60-64 Frequency 1 6. 12 4 3. .... The mean of the frequency distribution is degrees. (Round to the nearest tenth as needed.) Which of the following best describes the relationship between the computed mean and the actual mean? O A. The computed mean is not close to the actual mean because the difference between the means is more than 5% of the actual mean. O B. The computed mean is not close to the actual mean because the difference between the means is less than 5% of the actual mean. O C. The computed mean is close to the actual mean because the difference between the means is more than 5% of the actual mean. O D. The computed mean is close to the actual mean because the difference between the means is less than 5% of the actual mean.
Find the mean of the data summarized in the given frequency distribution. Compare the computed mean to the actual mean of 56.4 degrees. Low Temperature (o F) 40-44 •45-49 50-54 55-59 60-64 Frequency 1 6. 12 4 3. .... The mean of the frequency distribution is degrees. (Round to the nearest tenth as needed.) Which of the following best describes the relationship between the computed mean and the actual mean? O A. The computed mean is not close to the actual mean because the difference between the means is more than 5% of the actual mean. O B. The computed mean is not close to the actual mean because the difference between the means is less than 5% of the actual mean. O C. The computed mean is close to the actual mean because the difference between the means is more than 5% of the actual mean. O D. The computed mean is close to the actual mean because the difference between the means is less than 5% of the actual mean.

Glencoe Algebra 1, Student Edition, 9780079039897, 0079039898, 2018
18th Edition
ISBN:9780079039897
Author:Carter
Publisher:Carter
Chapter10: Statistics
Section10.4: Distributions Of Data
Problem 19PFA

Related questions
Question
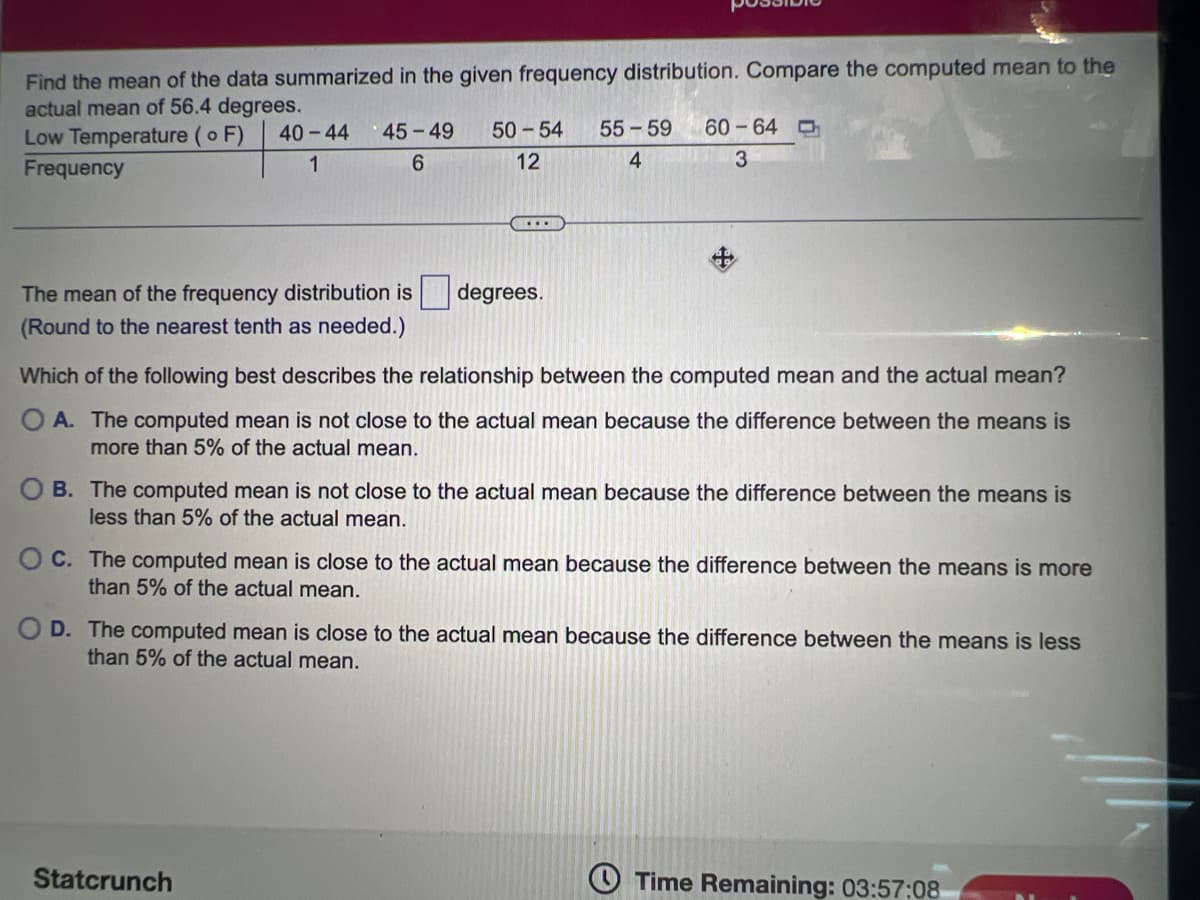
Transcribed Image Text:Find the mean of the data summarized in the given frequency distribution. Compare the computed mean to the
actual mean of 56.4 degrees.
Low Temperature (o F)
40-44
45-49
50-54
55-59
60-64 O
Frequency
1
6.
12
3
...
The mean of the frequency distribution is
(Round to the nearest tenth as needed.)
degrees.
Which of the following best describes the relationship between the computed mean and the actual mean?
OA. The computed mean is not close to the actual mean because the difference between the means is
more than 5% of the actual mean.
O B. The computed mean is not close to the actual mean because the difference between the means is
less than 5% of the actual mean.
O C. The computed mean is close to the actual mean because the difference between the means is more
than 5% of the actual mean.
O D. The computed mean is close to the actual mean because the difference between the means is less
than 5% of the actual mean.
Statcrunch
O Time Remaining: 03:57:08
Expert Solution
This question has been solved!
Explore an expertly crafted, step-by-step solution for a thorough understanding of key concepts.

This is a popular solution!

Trending now
This is a popular solution!

Step by step
Solved in 3 steps with 1 images

Recommended textbooks for you
Glencoe Algebra 1, Student Edition, 9780079039897…
Algebra
ISBN:
9780079039897
Author:
Carter
Publisher:
McGraw Hill
Glencoe Algebra 1, Student Edition, 9780079039897…
Algebra
ISBN:
9780079039897
Author:
Carter
Publisher:
McGraw Hill